The outline for this post is as follows:
Each numbered point in section 2 corresponds with a numbered portion of section 3. So there is no need to read this entire post; instead, you can see which numbered point you find interesting in section 2, and then for further details you can skip to the corresponding numbered portion in section 3.
This is the "+References" version of this post, which means that this post contains my full list of references and citations. If you would like an abbreviated and easier to read version, then please go to the "main version" of this post.
References are cited as follows: "[#]", with "#" corresponding to the reference number given in the References section at the end of this post.
Earth's atmosphere contains multiple layers. The layer closest to the Earth's surface air is known as the troposphere. Above the troposphere is the stratosphere. Climate models and basic physical theory predict how carbon dioxide (CO2) will affect temperature trends in the troposphere and stratosphere [60 - 62]. I addressed some of these predictions in my two part series on "John Christy and the Tropical Tropospheric Hot Spot" (part 1 and part 2), and in my post John Christy, Climate Models, and Long-term Tropospheric Warming".
Climate scientists estimate to estimate how much tropospheric and surface warming will result from a given increase in atmospheric CO2 [1; 2]. This leads to estimates of climate sensitivity (CS), where CS is the increase in global average temperature for a doubling of atmospheric CO2 levels. Various processes serve as either positive feedback that increases CS or negative feedback that limits CS. Equilibrium climate sensitivity (ECS) is Earth's CS when Earth is in an equilibrium state where Earth releases as much energy as it takes in, and fast feedbacks (as opposed to slower acting feedbacks) have exerted their full effect [1; 2]. Transient climate sensitivity (TCS or TCR) is Earth's CS over a shorter period of time, before Earth reaches equilibrium [1 - 3]. Different scientists give different definitions for CS and ECS [4], but the aforementioned definitions should suffice for this blogpost.
Scientists estimate CS in a number of ways, including:
Many critics of mainstream climate science argue for low estimates of CS. These low estimates serve at least two purposes. First, they undermine public confidence in high estimates of CS, including the higher estimates offered by the IPCC. Second, the lower CS estimates (supposedly) suggest that anthropogenic global warming may not be very serious, since anthropogenic CO2 will cause less global warming than scientists initially thought. So these low CS estimates imply that anthropogenic global warming would be "lukewarm." Thus lukewarmers are critics who claim that less anthropogenic global warming will occur due to a low CS [16 - 23; 283].
"Lord" Christopher Monckton is a prominent lukewarmer [36 - 47]. Monckton uses a simple energy budget climate model to argue for a low ECS of 1.0K, in a paper [24, page 131] Monckton co-authored with Willie Soon [27; 28; 256, from 1:30 to 4:28], David Legates [25, signer #17; 26], and William Briggs. Richardson et al. then wrote a rebuttal Monckton et al.'s paper [29]. Monckton et al. subsequently responded to this rebuttal [30]. In this part 1 post I will respond to some of Monckton et al.'s claims; in a subsequent post (part 2) I will respond to some of their other points.
In their two papers [24; 30], Monckton et al. make a number of claims, including:
So let's go over some of the issues with Monckton et al.'s arguments.
Monckton et al.'s arguments fail so miserably that neither of Monckton et al.'s two papers [24; 30] should have passed competent peer review. For instance, Monckton et al. blatantly misrepresent sources, as I discuss more in part 2. To borrow Monckton et al.'s response to Richardson et al.'s rebuttal [30, page 1387]:
Here, Monckton et al. are more than somewhat disingenuous.
Below is a brief summary of some of the shortcomings of Monckton et. al's arguments:
1) Monckton et al. used a flawed approach based on an energy budget model. This approach under-estimates CS, as do a number other CS estimates based on energy budget models. Correcting this flawed approach results in a higher estimate of CS, which conflicts with Monckton et al.'s lower CS estimate.
2) Monckton et al. remain unclear about how they generated their IPCC temperature predictions. This is a problem because Monckton has a history of misrepresenting IPCC temperature projections. Monckton et al. partake in this history of misrepresentation by distorting the IPCC's temperature projections for a high emissions scenario. This distortion involves Monckton et al. under-estimating projected global population and over-stating the IPCC's projected warming trend.
3) Monckton et al. exaggerate the model-data discrepancy with respect to tropospheric temperature. They do this by excluding data that shows tropospheric warming, using outdated data sets, cherry-picking short time periods, offering misleading temperature graphs, and not paying adequate attention to other possible explanations of the model-data discrepancy. Addressing these errors results in less of a model-data discrepancy and a greater global warming trend. This warming trend argues against Monckton et al.'s lower CS. Furthermore, the IPCC's 1990 temperature model-based predictions were more accurate than Monckton et al. claim and more accurate than Monckton et al.'s hypothesized trend, as per sections 1 and 2.1 of "Myth: The IPCC's 1990 Report Over-estimated Greenhouse-gas-induced Global Warming".
4) Many climate models predicted a temporary slowdown in global warming and global warming has continued over the past two decade, contrary to the claims made by Monckton et al. This warming bears the hallmarks of CO2-induced global warming, in combination with ozone recovery. In order to generate a pause/hiatus in global warming, Monckton et al. engage in end-point bias, cherry-pick short-time periods, fail to adequately account for short-term variables that influence short-term trends, and fail to adequately address the effects of stochastic noise on small sample sizes. Monckton et al. also incorrectly claim that if the IPCC's shorter term temperature predictions fail, then this calls into question the IPCC's longer term projections. Monckton et al.'s reasoning makes little sense since various factors often bias short-term trends, without those factors also biasing long-term trends. Furthermore, as the IPCC itself notes, shorter term variability is often not representative of longer term trends. This shorter-term variability does not support Monckton et al.'s lower ECS estimate.
5) UHI does not strongly bias surface temperature trends in the way Monckton et al. claim, since data analysis (via homogenization) corrects for the effect of UHI, most of the surface warming trend remains even after UHI is factored out, surface warming trends in rural areas often match warming trends from urban areas, much of the most intense warming occurs in non-urbanized areas, scientists do not observe UHI's predicted effect on temperature on windy vs. non-windy days, and the ocean warming trend provides UHI-independent verification of the land warming trend.
Let's examine each of these objections in turn.
Other scientists avoided some of the aforementioned mistakes committed by Monckton et al. [60; 67; 282, figure 1a]. These scientists also avoided the Monckton et al. misrepresentations I discussed in section 3.2, such as inventing linear, decadal temperature predictions and then falsely attributing those predictions to the IPCC [88; 90]. Correcting Monckton et al.'s errors results in better graphs of the model-data discrepancy [60; 67; 282, figure 1a]. Let's compare one of these graphs to a graph from Monckton et al.:
Figure 5 differs markedly from the corresponding figure 4, even though both figures purport to compare tropical mid-tropospheric temperature trends in observations vs. model predictions. Figure 5 exaggerates the model-data discrepancy in a way figure 4 does not. The remaining model-data discrepancy in figure 4 are likely due to a number of factors, including factors other than the models over-estimating CS (ex: factors such as observational uncertainty and model uncertainty) [60; 65].
The tropical upper tropospheric warming trends (in K per decade) for the four satellite data analyses in figure 4 are as follows [60, page 379]:
(The RSS, NOAA, and UW trends are fairly consistent with 5 out of 6 radiosonde trends for 1979-2014 and 2 out of 3 temperature re-analyses from 1979-2012 (in K per decade):
To compare these figures to Monckton et al.'s graph in figure 5, let's average the satellite temperature trends together (with or without the outlier UAH trend), and then multiply this average trend by 3.6 to convert the average trend into an average temperature increase from 1979 to 2015:
- Introduction
- Summary of the Objections
- Elaboration on the Objections
- References
Each numbered point in section 2 corresponds with a numbered portion of section 3. So there is no need to read this entire post; instead, you can see which numbered point you find interesting in section 2, and then for further details you can skip to the corresponding numbered portion in section 3.
This is the "+References" version of this post, which means that this post contains my full list of references and citations. If you would like an abbreviated and easier to read version, then please go to the "main version" of this post.
References are cited as follows: "[#]", with "#" corresponding to the reference number given in the References section at the end of this post.
1. Introduction
Climate scientists estimate to estimate how much tropospheric and surface warming will result from a given increase in atmospheric CO2 [1; 2]. This leads to estimates of climate sensitivity (CS), where CS is the increase in global average temperature for a doubling of atmospheric CO2 levels. Various processes serve as either positive feedback that increases CS or negative feedback that limits CS. Equilibrium climate sensitivity (ECS) is Earth's CS when Earth is in an equilibrium state where Earth releases as much energy as it takes in, and fast feedbacks (as opposed to slower acting feedbacks) have exerted their full effect [1; 2]. Transient climate sensitivity (TCS or TCR) is Earth's CS over a shorter period of time, before Earth reaches equilibrium [1 - 3]. Different scientists give different definitions for CS and ECS [4], but the aforementioned definitions should suffice for this blogpost.
Scientists estimate CS in a number of ways, including:
- Paleoclimate records: This involves using proxies to estimate CO2 levels and temperature in the distant past. Scientists can then use these data to estimate CO2's effect on temperature [1; 4].
- Historical / instrumental records: Similar to paleoclimate records, except scientists examine CO2 levels and temperature in the recent past, as opposed to the distant past [1; 6; 7].
- Climate models: Scientists generate climate models that are consistent with known physical laws, paleoclimate data, historical data, laboratory experiments performed on greenhouse gases such as CO2, and so on. These climate models range from very simple models generated in the 1800s, through more sophisticated models developed from the 1930s through the 1970s, to the complex climate models of today [1; 2; 5; 8, pages 1328, 1333, and 1334; 9, pages 68 - 72; 97]. Scientists compare these models to paleoclimate and historical data, to see which models best explain (or hindcast) the data [10; 11]. Scientists then use these validated models to project how much warming will result given increase in atmospheric CO2 [1; 2; 5; 8; 9]. This is consistent with standard scientific practice, since scientists in other fields justifiably use models to make projections about complex natural phenomena. For instance, oncologists can use biological models to project the likelihood that smokers will get lung cancer, despite the fact that oncologists do not know all of the biological processes involved in lung cancer [12; 13]. And astronomers generate astronomical models that fit with well-established physical laws and explain the motion of planets/satellites; astronomers then use those models to predict the motion of other planets/satellites, even though these models do not factor in the gravitational effect of every object in the universe [14; 15]. Similarly, climate scientists can use climate models to project how much warming will result from a given increase in CO2, even if climate scientists do not fully understand every process involved in global warming [1; 2; 5; 8; 9].
The following 2013 figure from the United Nations Intergovernmental Panel on Climate Change (IPCC) shows some recent estimates of TCR and ECS based on the estimation methods I discussed above [83, figure 10.20 on page 925]:

I discuss some other recent CS estimates in section 3.1. Scientists have made progress with respect to estimating CS [1; 2; 5], though research continues on this subject:

 |
Figure 1: Estimates of (a) TCR and (b) ECS from the scientific literature. The histogram height is proportional to the relative probability that CS is at the value shown on the horizontal axis. For example, the bottom panel on (b) includes Aldrin et al. 2012, where the maximum value for the histogram is around 1.7K, indicating that 1.7K is the most likely value for ECS of all possible ECS values examine in Aldrin et al. 2012. Horizontal bars show the probability range and the circles mark the median estimate. The dashed lines in (a) show estimates from a previous IPCC report (AR4). The boxes on the right-hand side indicate limitations and strengths of each line of evidence. A blue box implies an overall line of evidence that is well understood, has small uncertainty, or many studies and overall high confidence. Pale yellow indicates medium confidence, and dark red implies low confidence [83, figure 10.20 of page 925]. |
I discuss some other recent CS estimates in section 3.1. Scientists have made progress with respect to estimating CS [1; 2; 5], though research continues on this subject:
"Although uncertainties remain large, it would be presumptuous to say that science has made no progress, given the improvements in our ability to understand and simulate past climate variability and change [...] as well as in our understanding of key feedbacks [...]. Support for the current consensus range on [ECS] now comes from many different lines of evidence, the ranges of which are consistent within the uncertainties, relatively robust towards methodological assumptions (except for the assumed prior distributions [...]) and similar for different types and generations of models. The processes contributing to the uncertainty are now better understood [1]."
"Thus, the fact that the range for climate sensitivity today is similar as was guessed by Charney over three decades ago based on sketchy evidence should not be interpreted as a lack of progress, and using the range of ECS as a measure of success for climate research fails to characterize the state of research [2]."
Many critics of mainstream climate science argue for low estimates of CS. These low estimates serve at least two purposes. First, they undermine public confidence in high estimates of CS, including the higher estimates offered by the IPCC. Second, the lower CS estimates (supposedly) suggest that anthropogenic global warming may not be very serious, since anthropogenic CO2 will cause less global warming than scientists initially thought. So these low CS estimates imply that anthropogenic global warming would be "lukewarm." Thus lukewarmers are critics who claim that less anthropogenic global warming will occur due to a low CS [16 - 23; 283].
"Lord" Christopher Monckton is a prominent lukewarmer [36 - 47]. Monckton uses a simple energy budget climate model to argue for a low ECS of 1.0K, in a paper [24, page 131] Monckton co-authored with Willie Soon [27; 28; 256, from 1:30 to 4:28], David Legates [25, signer #17; 26], and William Briggs. Richardson et al. then wrote a rebuttal Monckton et al.'s paper [29]. Monckton et al. subsequently responded to this rebuttal [30]. In this part 1 post I will respond to some of Monckton et al.'s claims; in a subsequent post (part 2) I will respond to some of their other points.
In their two papers [24; 30], Monckton et al. make a number of claims, including:
- The IPCC uses general-circulation climate models (GCMs) that over-estimate the real rate of global warming [30, pages 1384, 1385, figures 7 and 8 on page 1385, figure 9 on page 1387]. I will call this the model-data discrepancy, in keeping with my post "John Christy, Climate Models, and Long-term Tropospheric Warming". Monckton et al. use this model-data discrepancy to argue that the IPCC's 1990 temperature prediction over-estimated the rate of global warming [24; pages 123, 124, and 32; 30, pages 1381 and 1382].
- Temperature data fit better with the predictions of Monckton et al.'s simple energy budget model, as opposed to the predictions made by the GCMs used by the IPCC [24, page 132; 30, pages 1381 - 1383]. This supports a lower CS, since Monckton et al.'s model implies a net negative feedback that limits global warming and keeps CS low [24, page 132; 30, pages 1380, 1381, and 1387].
- The IPCC's offers an unjustified temperature projection showing ~12K of extreme global warming in response to very high greenhouse gas emissions [30, page 1379]. This biased projection depends on over-estimating global population [24; pages 133 and 134].
- There has been a pause/hiatus in significant global warming for about two decades and this pause/hiatus was not predicted by GCMs [24, pages 122 and 127; 30, pages 1379, 1385, and 1387].
- The IPCC accepts that its short-term predictions failed. This raises questions about the IPCC's longer-term predictions [30, page 1388].
- The urban heat-island effect (UHI) involves surface temperature stations recording warming that results from urbanization, as opposed to a changing climate [206; 208]. UHI biases temperature station records, causing climate scientists to mistake UHI-induced warming for warming induced by climatic factors [30, pages 1380 and 1382].
So let's go over some of the issues with Monckton et al.'s arguments.
2. Summary of the Objections
Here, Monckton et al. are more than somewhat disingenuous.
Below is a brief summary of some of the shortcomings of Monckton et. al's arguments:
1) Monckton et al. used a flawed approach based on an energy budget model. This approach under-estimates CS, as do a number other CS estimates based on energy budget models. Correcting this flawed approach results in a higher estimate of CS, which conflicts with Monckton et al.'s lower CS estimate.
2) Monckton et al. remain unclear about how they generated their IPCC temperature predictions. This is a problem because Monckton has a history of misrepresenting IPCC temperature projections. Monckton et al. partake in this history of misrepresentation by distorting the IPCC's temperature projections for a high emissions scenario. This distortion involves Monckton et al. under-estimating projected global population and over-stating the IPCC's projected warming trend.
3) Monckton et al. exaggerate the model-data discrepancy with respect to tropospheric temperature. They do this by excluding data that shows tropospheric warming, using outdated data sets, cherry-picking short time periods, offering misleading temperature graphs, and not paying adequate attention to other possible explanations of the model-data discrepancy. Addressing these errors results in less of a model-data discrepancy and a greater global warming trend. This warming trend argues against Monckton et al.'s lower CS. Furthermore, the IPCC's 1990 temperature model-based predictions were more accurate than Monckton et al. claim and more accurate than Monckton et al.'s hypothesized trend, as per sections 1 and 2.1 of "Myth: The IPCC's 1990 Report Over-estimated Greenhouse-gas-induced Global Warming".
4) Many climate models predicted a temporary slowdown in global warming and global warming has continued over the past two decade, contrary to the claims made by Monckton et al. This warming bears the hallmarks of CO2-induced global warming, in combination with ozone recovery. In order to generate a pause/hiatus in global warming, Monckton et al. engage in end-point bias, cherry-pick short-time periods, fail to adequately account for short-term variables that influence short-term trends, and fail to adequately address the effects of stochastic noise on small sample sizes. Monckton et al. also incorrectly claim that if the IPCC's shorter term temperature predictions fail, then this calls into question the IPCC's longer term projections. Monckton et al.'s reasoning makes little sense since various factors often bias short-term trends, without those factors also biasing long-term trends. Furthermore, as the IPCC itself notes, shorter term variability is often not representative of longer term trends. This shorter-term variability does not support Monckton et al.'s lower ECS estimate.
5) UHI does not strongly bias surface temperature trends in the way Monckton et al. claim, since data analysis (via homogenization) corrects for the effect of UHI, most of the surface warming trend remains even after UHI is factored out, surface warming trends in rural areas often match warming trends from urban areas, much of the most intense warming occurs in non-urbanized areas, scientists do not observe UHI's predicted effect on temperature on windy vs. non-windy days, and the ocean warming trend provides UHI-independent verification of the land warming trend.
Let's examine each of these objections in turn.
3. Elaboration on the Objections
3.1 Using an energy budget model to under-estimate CS
Energy budget models are one model-based approach for estimating CS. However, in comparison to other methods of estimating CS, energy budget models often generate lower estimates of CS [48; 56; 317; 322, page 3] due to a number of limitations [29; 48 - 55; 57; 317; 319; 322, page 3], including under-estimating actual rates of historical warming [49; 322, page 3] and inaccurately representing the influence of aerosols on Earth's temperature [50; 52]. Correcting these errors results in higher estimates of climate sensitivity [29; 48 - 50; 52 - 55; 57; 319]. So if you have ever heard a lukewarmer claim that they "showed CS was low using observational data," then the lukewarmer likely used an energy budget model plus observational data [51; 56; 322, page 3]. It is therefore not surprising that Monckton et al. would opt for an approach based on an energy budget model [24; 30], since this approach allows them to under-estimate CS.
3.2 Disregarding other plausible explanations of the model-observations discrepancy
Monckton et al. do not clearly explain how they generated their IPCC temperature projection for tropospheric temperature [24; figure 1 on page 123, figure 2 on page 124, figure 6 on page 132; 30, figure 9 on page 1387]. This is especially important because Monckton has a history of misrepresenting IPCC's projections. Monckton's misrepresentations include treating projections as failed predictions. To explore this issue further, let's first distinguish between projections and predictions.
In climate science, a projection states what will likely happen, given a set of initial conditions. A prediction states what will actually happen [338, page 943; 339; 340, pages 120 and 126]. For example, take the following two simple projections made by James:
"The red car did not hit Earl. So James was wrong when he predicted that the red car would hit Earl. James is thus an alarmist who tried to needlessly frighten Earl."
Monk's claim fails since James did not predict that Earl would be hit by the red car. Instead James projected that Earl would be hit by the car, if Earl crossed the street at 17:00. Since the "Earl crossed the street at 17:00" sufficient condition was not met, then James did not predict that Earl would be hit by the red car. Thus Monk conflated James' projection with James' prediction.
Monckton et al. commit this same misrepresentation [88; 89]. For example, Monckton et al. take climate projections made by the climate scientist James Hansen, and then imply that Hansen's projections do not match the observations [24, figure 6 on page 132]. Of course, Monckton et al. fail to mention that Hansen's projections were based on sufficient conditions that were not met, and thus it would be unfair to treat these Hansen's projections as dis-confirmed predictions [85 - 87; 326, page 558; 327 - 329]. Hansen's actual temperature prediction is more accurate [84; 267, pages 9 - 11; 326, page 557; 327 - 330] than Monckton et al. imply [24, figure 6 on page 132].
Monckton misrepresents temperature projections in other ways, including:
Given this history of misrepresentation, it should be no surprise that Monckton et al. misrepresent IPCC projections for the RCP8.5 (representative concentration pathway) scenario. RCP8.5 is a high emissions scenario, where humans continue to burn fossils in a "business-as-usual" manner [93, page 43]. Monckton et al. claim that the IPCC RCP8.5 scenario projects 12K of warming by 2100, if humans burn all the recoverable fossil fuel reserves [24; page 134; 30, page 1379]. Monckton et al. provide no evidence in support their claim. Furthermore, I cannot find any evidence that the RCP8.5 involves human burning all the recoverable fossil fuel reserves in a way that leads to 12 K of warming. Instead RCP8.5 depicts a "relatively conservative business as usual case with low income, high population and high energy demand due to only modest improvements in energy intensity [93, page 43]," with a surface temperature increase of no more than 8K by 2100 [91, figure 12.5 on page 1054; 92, pages AISM-8 and AISM-9; 94, figure 1; 95]. So Monckton et al. likely generated the 12K projection by illegitimately extending the RCP8.5 projection outside of RCP8.5's sufficient conditions.
Monckton et al. also claim that RCP8.5 likely over-estimates the size of Earth's future population:
"Fifthly, application of the simple model raises the question why AR5 adopted the extreme RCP 8.5 scenario at all. On that scenario, atmospheric CO2 concentration is projected to reach 936 ppmv by 2100 on the basis of two implausible assumptions: first, that global population will be 12 billion by 2100, though the UN predicts that population will peak at little more than 10 billion by not later than 2070 and will fall steeply thereafter [...] [24, pages 133 and 134]."
This is false. The UN projects global temperature to be just below 11 billion by 2100, with a population of 12 billion being well within the range of plausible values [96, figure 1A on page 235]. Furthermore, a 2100 global population of 12 billion is within the range of values presented in the scientific literature on emissions scenarios [93, figure 4 on page 44]. These points are illustrated in figures 2A and 3 (top right panel) below [93; 96]:
In summary: there is little reason to think that Monckton et al. accurately represented IPCC temperature projections and predictions [24; figure 1 on page 123, figure 2 on page 124, figure 6 on page 132; 30, figure 9 on page 1387], given Monckton's history of misrepresenting IPCC's projections and Monckton et al.'s misleading claims about the RCP8.5 scenario [24; pages 133 and 134; 30, page 1379]. So one has little reason for accepting Monckton et al.'s claim that observed warming rates fit better with Monckton et al.'s model energy budget model as opposed to the IPCC's model-based predictions [24, page 132; 30, pages 1381 - 1383, 1387]. This undermines Monckton et al.'s model-based rationale for a low CS estimate.
In climate science, a projection states what will likely happen, given a set of initial conditions. A prediction states what will actually happen [338, page 943; 339; 340, pages 120 and 126]. For example, take the following two simple projections made by James:
- If Earl crosses the street at 17:00, then the red car will hit Earl.
- If Earl does not cross the street at 17:00, then the red car will not hit Earl.
"The red car did not hit Earl. So James was wrong when he predicted that the red car would hit Earl. James is thus an alarmist who tried to needlessly frighten Earl."
Monk's claim fails since James did not predict that Earl would be hit by the red car. Instead James projected that Earl would be hit by the car, if Earl crossed the street at 17:00. Since the "Earl crossed the street at 17:00" sufficient condition was not met, then James did not predict that Earl would be hit by the red car. Thus Monk conflated James' projection with James' prediction.
Monckton et al. commit this same misrepresentation [88; 89]. For example, Monckton et al. take climate projections made by the climate scientist James Hansen, and then imply that Hansen's projections do not match the observations [24, figure 6 on page 132]. Of course, Monckton et al. fail to mention that Hansen's projections were based on sufficient conditions that were not met, and thus it would be unfair to treat these Hansen's projections as dis-confirmed predictions [85 - 87; 326, page 558; 327 - 329]. Hansen's actual temperature prediction is more accurate [84; 267, pages 9 - 11; 326, page 557; 327 - 330] than Monckton et al. imply [24, figure 6 on page 132].
Monckton misrepresents temperature projections in other ways, including:
- Treating the IPCC's ECS estimates as being equivalent to TCS estimates [88; 89].
- Incorrectly treating average centennial temperature projections as being directly translatable into linear, decadal trend predictions. This makes no sense since shorter, decadal time periods are more prone to the effects of short-term factors and stochastic noise, and thus one not necessarily expect a decadal temperature trend to be a match the average centennial trend [88; 90] (for more on this see section 3.4, or see sections 3.3 and 3.4 of John Christy, Climate Models, and Long-term Tropospheric Warming)
Given this history of misrepresentation, it should be no surprise that Monckton et al. misrepresent IPCC projections for the RCP8.5 (representative concentration pathway) scenario. RCP8.5 is a high emissions scenario, where humans continue to burn fossils in a "business-as-usual" manner [93, page 43]. Monckton et al. claim that the IPCC RCP8.5 scenario projects 12K of warming by 2100, if humans burn all the recoverable fossil fuel reserves [24; page 134; 30, page 1379]. Monckton et al. provide no evidence in support their claim. Furthermore, I cannot find any evidence that the RCP8.5 involves human burning all the recoverable fossil fuel reserves in a way that leads to 12 K of warming. Instead RCP8.5 depicts a "relatively conservative business as usual case with low income, high population and high energy demand due to only modest improvements in energy intensity [93, page 43]," with a surface temperature increase of no more than 8K by 2100 [91, figure 12.5 on page 1054; 92, pages AISM-8 and AISM-9; 94, figure 1; 95]. So Monckton et al. likely generated the 12K projection by illegitimately extending the RCP8.5 projection outside of RCP8.5's sufficient conditions.
Monckton et al. also claim that RCP8.5 likely over-estimates the size of Earth's future population:
"Fifthly, application of the simple model raises the question why AR5 adopted the extreme RCP 8.5 scenario at all. On that scenario, atmospheric CO2 concentration is projected to reach 936 ppmv by 2100 on the basis of two implausible assumptions: first, that global population will be 12 billion by 2100, though the UN predicts that population will peak at little more than 10 billion by not later than 2070 and will fall steeply thereafter [...] [24, pages 133 and 134]."
This is false. The UN projects global temperature to be just below 11 billion by 2100, with a population of 12 billion being well within the range of plausible values [96, figure 1A on page 235]. Furthermore, a 2100 global population of 12 billion is within the range of values presented in the scientific literature on emissions scenarios [93, figure 4 on page 44]. These points are illustrated in figures 2A and 3 (top right panel) below [93; 96]:
 |
Figure 2: (A) Top panel: UN 2012 world population projection (solid red line), with 80% prediction interval (dark shaded area), 95% prediction interval (light shaded area), and the traditional UN high and low variants from adding or subtracting half a child from the total fertility rate (dashed blue lines). The prediction interval is the range of values that future data will fall into, with a given probability. (B) Bottom panel: UN 2012 population projections by continent. In both panels, the vertical dashed line denotes 2012 [96]. |
 |
Figure 3: Global development of population in RCP 8.5 (red lines) compared to the range of scenarios from the literature (grey areas: database of scenarios used in the previous IPCC AR4 report). Right hand vertical lines give the AR4 database range in 2100, including the 5th, 25th, 50th, 75th, and 95th percentile of the IPCC AR4 scenario distribution [93]. |
In summary: there is little reason to think that Monckton et al. accurately represented IPCC temperature projections and predictions [24; figure 1 on page 123, figure 2 on page 124, figure 6 on page 132; 30, figure 9 on page 1387], given Monckton's history of misrepresenting IPCC's projections and Monckton et al.'s misleading claims about the RCP8.5 scenario [24; pages 133 and 134; 30, page 1379]. So one has little reason for accepting Monckton et al.'s claim that observed warming rates fit better with Monckton et al.'s model energy budget model as opposed to the IPCC's model-based predictions [24, page 132; 30, pages 1381 - 1383, 1387]. This undermines Monckton et al.'s model-based rationale for a low CS estimate.
3.3 Over-estimating discrepancies between data and model-based predictions
Monckton et al. over-estimate the model-data discrepancy when it comes to tropospheric temperature data. Many of these exaggerations stem from Monckton et al. adapting a flawed graph [30, figure 6 on page 1385] made by the climate scientist John Christy. Correcting these exaggerations reduces the model-data discrepancy and augments the observed tropospheric warming trend. These corrections also show that Monckton et al.'s energy budget model under-estimates the observed tropospheric warming trend, and thus Monckton et al.'s model-based approach likely under-estimates CS.
Monckton et al. exaggerate the model-data discrepancy in at least the following ways (for more on these exaggerations, see the cited sections from "John Christy, Climate Models, and Long-term Tropospheric Warming"):
Monckton et al. exaggerate the model-data discrepancy in at least the following ways (for more on these exaggerations, see the cited sections from "John Christy, Climate Models, and Long-term Tropospheric Warming"):
- Monckton et al. use an outdated satellite-based temperature analysis from Remote Sensing Systems (RSS) [30, table 1 on page 1381, table 2 on page 1382, figure 7 on page 1385, figure 8 on page 1386, and figure 9 on page 1387] that contains a cold bias acknowledged by the RSS team [294; 303]; RSS corrected this bias in a later analysis [303]. Monckton et al. also do not use an improved RSS analysis that shows greater tropospheric warming [58; 303] and they do not include a similar satellite-based analysis from a research team at the National Oceanic and Atmospheric Administration Center for Satellite Applications and Research (NOAA/STAR) [59; 63; 64]. This NOAA analysis also shows greater tropospheric warming. Incorporating this data would likely reduce Monckton et al.'s model-data discrepancy (sections 3.1 and 3.2).
- Monckton et al. do not use three satellite data analyses (RSS, NOAA, UAH (University of Alabama in Huntsville)) that were corrected for stratospheric cooling [30, table 1 on page 1381, table 2 on page 1382, figures 6 and 7 on page 1385]. These data analyses show augmented tropospheric warming globally and in the tropics [60], reducing the model-data discrepancy presented by Monckton et al. [30, page 1385] (sections 3.1 and 3.2).
- Monckton et al. do not use a satellite data analysis for the tropics from a research team at the University of Washington (UW) [30, figure 6 on page 1385, page 1387]. This analysis shows increased tropical tropospheric warming [59; 60], further reducing Monckton et al.'s model-data discrepancy (sections 3.1 and 3.2).
- Monckton et al.'s analysis [30; figure 6 on page 1385] does not include weather balloon (radiosonde) temperature records and temperatures re-analyses that show tropospheric warming [72 - 76; 282]. Including this data would likely reduce the model-data discrepancy.
- Monckton et al. do not mention the spurious cooling in the radiosonde temperature records that they use [30, figure 6 on page 1385], even though this cold bias [59; 61; 62; 66, page 19; 79; 80; 282] was commented on in a report co-authored by Christy [62]. Correcting this cold bias would reduce the model-data discrepancy (section 3.1).
- Monckton et al. average data-sets together, obscuring the observational uncertainty in the data [24, figure 1 on page 123]. This uncertainty results from, in part, differences between data-sets [60, pages 374 and 379; 61; 62, page 3; 65, pages 2 - 4; 66, page 24]. Properly depicting this observational uncertainty would reduce the model-data discrepancy, and show that much of the discrepancy is due to observational uncertainty, as opposed to errors in the GCMs [60; 67] (sections 3.3 and 3.6). Monckton et al. further obscure observational uncertainty by mentioning the UAH data analysis [30, page 1385], without illustrating how much Christy's UAH results differ from the results of other research groups [59; 60; 68]. These differences likely result from errors in UAH's data analysis [59 - 61; 63; 64; 66, pages 17 - 19; 68 - 71], consistent with UAH's history of errors in satellite data analysis [61; 71; 97, from 36:31 to 37:10]. The UAH team likely under-estimated the rate of tropospheric warming [59; 60]. Correcting UAH's errors would likely reduce the model-data discrepancy (section 3.1 and 3.2).
- Monckton et al. do not adequately represent the structural uncertainty in GCM-based warming projections [30, figures 6 and 7 on page 1385], and thus commit the same mistake as Christy [77; 78]. As with observational uncertainty, displaying model uncertainty would reduce the model-data discrepancy and show that this model uncertainty explains much of the model-data discrepancy [60; 67] (section 3.6).
- Monckton et al. suggest that the model-data discrepancy is likely due to GCMs over-estimating the real warming trend [30; page 1388], and they canvass some possible explanations for this over-estimation [30; page 1385]. However, Monckton et al. do not pay sufficient attention to other plausible alternative explanations for the discrepancy; observational uncertainty is one such alternative explanation, as is short-term variability [60, pages 374 and 379; 61; 62, page 3; 65, pages 2 - 4; 66, page 24]. Scientific evidence supports these alternative explanations [60, page 379; 65, pages 3 and 4] and these explanations do not imply a flaw in the GCMs [65, pages 3 and 4] (section 3.3).
- Taking short-term variability into account shows the IPCC's 1990 temperature prediction was more accurate [81; 327; 356] than Monckton et al. claim [30, pages 1381 and 1382], as were other temperature mainstream temperature predictions [82; 356]. In fact, the IPCC's 1990 forecast was more accurate than Monckton et al.'s hypothesized trend, as per sections 1 and 2.1 of "Myth: The IPCC's 1990 Report Over-estimated Greenhouse-gas-induced Global Warming".
Other scientists avoided some of the aforementioned mistakes committed by Monckton et al. [60; 67; 282, figure 1a]. These scientists also avoided the Monckton et al. misrepresentations I discussed in section 3.2, such as inventing linear, decadal temperature predictions and then falsely attributing those predictions to the IPCC [88; 90]. Correcting Monckton et al.'s errors results in better graphs of the model-data discrepancy [60; 67; 282, figure 1a]. Let's compare one of these graphs to a graph from Monckton et al.:
 |
Figure 4: Mid- to upper tropical tropospheric warming trends predicted by climate models and observed in satellite data analyses. The pink line is the observed tropospheric warming trend, corrected for stratospheric cooling and shown as an average of the UAH, RSS, NOAA, and UW satellite data analyses. The black line shows the average warming trend from an ensemble of climate models, while the gray region shows the range of values taken by different realizations of each model [60]. |
 |
Figure 5: Tropical mid-tropospheric temperature trends from 1979 to 2012, as predicted by climate models, with observations from radiosonde and satellites [30]. |
Figure 5 differs markedly from the corresponding figure 4, even though both figures purport to compare tropical mid-tropospheric temperature trends in observations vs. model predictions. Figure 5 exaggerates the model-data discrepancy in a way figure 4 does not. The remaining model-data discrepancy in figure 4 are likely due to a number of factors, including factors other than the models over-estimating CS (ex: factors such as observational uncertainty and model uncertainty) [60; 65].
The tropical upper tropospheric warming trends (in K per decade) for the four satellite data analyses in figure 4 are as follows [60, page 379]:
- RSS : ~0.18
- NOAA : ~0.20
- UW : ~0.16
- UAH : ~0.10
(The RSS, NOAA, and UW trends are fairly consistent with 5 out of 6 radiosonde trends for 1979-2014 and 2 out of 3 temperature re-analyses from 1979-2012 (in K per decade):
- Five radiosonde analyses each generally have upper tropospheric temperature trends of [282, figures 2a and 2b] : >0.17
- Met Office Hadley Centre (HadAT2) radiosonde analysis [282, figures 2a and 2b] : >0.11
- Modern Era Retrospective-Analysis for Research and Applications (MERRA) re-analysis [260, figure 7] : ~0.26
- European Centre for Medium-Range Weather Forecasts Interim re-analysis (ERA-I) [260, figure 7] : ~0.22
- National Centers for Environmental Prediction (NCEP-2) re-analysis [260, figure 7] : ~0.08
To compare these figures to Monckton et al.'s graph in figure 5, let's average the satellite temperature trends together (with or without the outlier UAH trend), and then multiply this average trend by 3.6 to convert the average trend into an average temperature increase from 1979 to 2015:
- Average temperature increase without UAH : ~0.65K
- Average temperature increase with UAH : ~0.58K
3.4 Cherry-picking short time periods to generate a pause/hiatus in global warming
Monckton et al. select short time-frames for examining RSS data [30, figure 8 on page 1386, figure 9 on page 1387] and claim that models failed to predict a period of almost two decades without significant global warming [24; pages 122 and 127; 30, pages 1379, 1385, and 1387]. In making these claims, Monckton et al. again repeat the same errors made by John Christy [60; 98]. I discuss some of these mistakes in sections 3.4 and 3.5 of "John Christy, Climate Models, and Long-term Tropospheric Warming". Here is a summary of some of the errors committed by Monckton et al.:
To make these points even clearer, let's examine RSS' mid-tropospheric temperature analysis and the HadCRUT surface temperature analysis, since Monckton et al. rely on both of RSS and HadCRUT [24, pages 123, 128, 129, 132; 30, page 1385]:
Figure 6 shows that the short-term temperature trend that begins with a strong El Niño (solid green line in figure 6) under-estimates the long-term warming trend (dotted black line in figure 6) [75], in accordance with the IPCC's aforementioned assessment [152, page 194]. Figure 8 also shows how one's start point and end-point greatly impact the magnitude of the short-term trend [60]. For example, one can follow Monckton et al.'s example and have a strong El Niño year near one's chosen start point, while not having an El Niño near one's end-point [30, figure 8 on page 1386]. Such blatant cherry-picking allows Monckton et al. to generate and exploit a non-representative, short-term trend; this is analogous to choosing the short-term green trend in figure 6, over the long-term black trend in figure 6.
Figures 6 to 9 also show that 2016 was warmer, on average, than 1998. One might object that figure 4 from section 3.3 [60] shows that 2016 is not warmer than 1997-1998. However, this objection is incorrect. Figure 4 depicts upper tropospheric warming in the tropics. When one examines the near-global upper tropospheric trend, then it becomes clear that 2016 was warmer, on average, than 1998:
So figures 6 to 10 show a warming trend from 1998 to 2016 [60, 90, 201]. Once again, this warming trend is not wholly attributable to ENSO, since the El Niño of 2015-2016 was about as strong as (or weaker than [295]) the El Niño of 1997-1998 in terms of warming of the ocean surface [150] (with the 2015-2016 El Niño having less ocean warming in some regions, and greater ocean warming in other regions, than did the 1997-1998 El Niño [253, figure 2; 254]). So if one wanted to investigate the underlying global warming trend, then comparing 1998 to any subsequent year other than an equally strong El Niño year (such as 2016) would be misleading, since ENSO would skew the start point for that short-term trend. This confirms that the global warming trend remains even after correcting for ENSO, as shown in other sources [157 - 164].
The underlying global warming trend is largely caused by CO2. To see why, first note that since the 1800s, atmospheric CO2 levels increased in a roughly exponential manner [234; 235; 236, page 3]. Given the logarithmic relationship between increased CO2 and increased temperature [1, pages 736 and 740; 232; 233], this near-exponential increase in CO2 caused a near-linear CO2-induced warming trend [157; 166; 230 - 233; 240 - 242], though the linearity breaks down in extreme cases [288]. Short-term variability (from factors such as ENSO) and chance / statistical noise temporarily augmented or mitigated this near-linear CO2-induced warming trend [157; 233; 240], as depicted in figures 6, 8, and 9. Figure 10b depicts the linear warming trend more clearly, with much of the short-term variability removed [157]:
So it would be misleading to cherry-pick a short period of mitigated global warming, in order to argue against estimate sof the long-term CO2-induced warming trend. But this fact did not stop Monckton et al. from cherry-picking a two-decade long period of reduced global warming, in order to argue against GCM-based projections of CO2-induced warming [24; pages 122 and 127; 30, pages 1379, 1385, and 1387]. Monckton et al.'s cherry-picking does not change the fact that global warming has occurred over the past two decades, nor does it change the fact that short-term temperature fluctuations should not undermine confidence in GCM-based temperature predictions. Monckton et al.'s cherry-picking also fails to support their CS estimate. Instead, incorporating the recent warming period still supports higher CS estimates [156; 246; 247], even if one does not take into account all of the other factors that cause CS to be under-estimated (factors I discussed in section 3.1).
- Monckton et al.'s cherry-picking of short-term variability, does not change the long-term global warming trend and does not show that long-term global warming underwent a "pause/hiatus". One can justifiably investigate short-term variability and the factors influencing short-term trends, while accepting that there is an underlying, long-term global warming trend [60; 152, page 194; 156; 157; 159; 160; 165 - 179; 323]. So, for example, the same data that shows long-term global warming and global warming over the past 18 years [75], can also be used to investigate the short-term climate variability that temporally dampens the rate of global warming [179]. This point remains compatible with skepticism about the existence of a recent, significant pause/hiatus in global warming [100 - 102; 110; 154; 180 - 189]. One would expect variability to temporally augment or mitigate a long-term global warming trend; therefore, it is not surprising that the rate of global warming temporarily decreased after the late 1990s. Such behavior occurred in past warming periods and climate model simulations [165; 171; 175; 178; 190 - 194], contrary to the false claims of Monckton et al. [24; pages 122 and 127; 30, pages 1385 and 1387]. Scientists have commented on past periods of mitigated warming since at least the 1980s [238; 239]. No doubt future "skeptics" will follow Monckton et al.'s example by cherry-picking periods of mitigated warming and using these periods of argue for a "pause/hiatus" in long-term global warming.
- Though some disagreement remains [170], models incorporating short-term natural variability (such as ENSO) and CO2-induced global warming have done better at modelling the current warming period [156; 165 - 167; 169; 175; 246; 255], especially with respect to ocean warming [298; 307]. One would expect such a result if short-term variability temporarily augmented or mitigated a long-term, CO2-induced global warming trend. This is somewhat analogous to explaining average Canadian temperature from mid-winter to mid-summer by having short-term, multi-day or multi-week weather patterns layered on top of long-term, multi-month warming caused by changes in Earth's axial tilt relative to the Sun (I discuss this analogy further in section 3.4 of "John Christy, Climate Models, and Long-term Tropospheric Warming").
- Monckton et al. cherry-picked a warm start point (1997-1998) for their trend and made sure that the start point was biased by a short-term fluctuation. This short-term fluctuation is the El Niño phase of ENSO, an ocean cycle in which the oceans' surface and the troposphere temporarily warm [60; 150]. Scientists and non-scientists emphasize the dangers of choosing short-term trends [66, page 16] that begin with a strong El Niño year like 1998 [60; 61; 65; 101; 151; 152, page 194; 153 - 156; 304], especially given the 1998 transition in satellite temperature monitoring equipment [61, pages 69 and 72; 65, pages 2 - 3]. The RSS team repeat this warning [304], as do Richardson et al. [29, page 1371], but to no avail; Monckton et al. cherry-pick anyway [30, page 1386]. To address the effect of ENSO, scientists also often examine temperature trends after correcting for short-term cyclical factors such as ENSO. Correcting for ENSO reveals the underlying long-term global warming trend, a trend that continues over the last two decades [157 - 164; 246]; tropospheric temperatures increased from 1997-1998 to 2015-2016 [60; 72; 75], even though the 1997-1998 El Niño was about as strong as (or possibly stronger than [295]) the 2015-2016 El Niño in terms of warming of the ocean surface [150] (with the 2015-2016 El Niño having less ocean warming in some regions, and greater ocean warming in other regions, than did the 1997-1998 El Niño [253, figure 2; 254]).
- There has been global warming over the past couple of decades, as observed in surface and ocean warming [75; 99 - 111; 297 - 299; 307], tropospheric warming [58; 60; 72; 75; 243; 282, figure 3; 303], and Earth's energy balance (the amount of energy the Earth takes up vs. the amount of energy the Earth releases) [113; 114; 306, figure 3; 307; 325]. This warming runs contrary to Monckton et al.'s of no recent global warming [24; pages 122 and 127; 30, page 1379, 1385, 1387]. Recent warming bears the hallmarks of CO2-induced global warming, in combination with ozone stabilization. Namely: ozone depletion [117 - 122; 127; 135] and increased CO2 [62; 118; 121; 123 - 126; 135; 237] caused stratospheric cooling up to the mid-1990s [72; 119; 120; 135; 137 - 143; 237], as predicted by the scientific community during the 1960s, 1970s, and 1980s [97, from 26:23 to 29:54; 115; 116; 144 - 148]. Atmospheric warming caused by ENSO [120; 127; 161; 195] or the Sun [62; 120; 123 - 125; 127; 161; 196 - 198; 199, page 674; 200] would not produce most of the stratospheric cooling that has been observed. Ozone stabilization (in response to international treaties such as the Montreal Protocol [128 - 134]) mitigated [117 - 122; 127] lower stratospheric cooling from the mid-1990s to the present [62; 122; 127; 237], though recent stratospheric cooling remains in many data-sets [117 - 120; 138 - 143], especially higher in the stratosphere [117 - 120; 138 - 141; 143]. This is in agreement with scientific predictions made in the 1970s and 1980s [115; 116; 136]. Increased CO2 levels also caused a shift in Earth's energy balance [112; 113; 306; 307] and greater absorption of energy (meaning increased radiative forcing) within specific infrared wavelengths that CO2 is known to absorb [149; 311].
- Monckton et al. engage in end-point bias [153] when they insinuate that a short-term temperature fluctuation paused a long-term warming trend [24; pages 122 and 127; 30, page 1379, 1385, 1387]. This is especially problematic since short-term factors can bias short-term trends, without those factors also biasing longer trends [62, page 3; 65, page 4; 66, page 27]. Short-term trends can also be biased by chance / statistical noise, while larger sample sizes are not as prone to these effects. So shorter term variability is often not representative of longer term trends, as the IPCC itself notes [152, page 194]. It is therefore unlikely that the IPCC would claim that the failure of short-term predictions implies a problem for long-term predictions. Yet Monckton et al. imply the opposite; Monckton et al. raise questions about the IPCC's longer-term predictions, because Monckton et al. claim (without any citation to the IPCC) that the IPCC accepts that its short-term predictions failed [30, page 1388]. Monckton et al.'s representation of the IPCC is difficult to reconcile with what the IPCC actually says:
To make these points even clearer, let's examine RSS' mid-tropospheric temperature analysis and the HadCRUT surface temperature analysis, since Monckton et al. rely on both of RSS and HadCRUT [24, pages 123, 128, 129, 132; 30, page 1385]:
 |
Figure 6: Trend in global, monthly, mean surface temperature from 1979 to 2016 relative to baseline of 1981 - 2010, as shown in multiple temperature analyses. The solid green trend-line is represents the trend for 1998 - 2012, while the dotted black trend-line represents the trend for the full period from 1979 - 2016 [75]. |
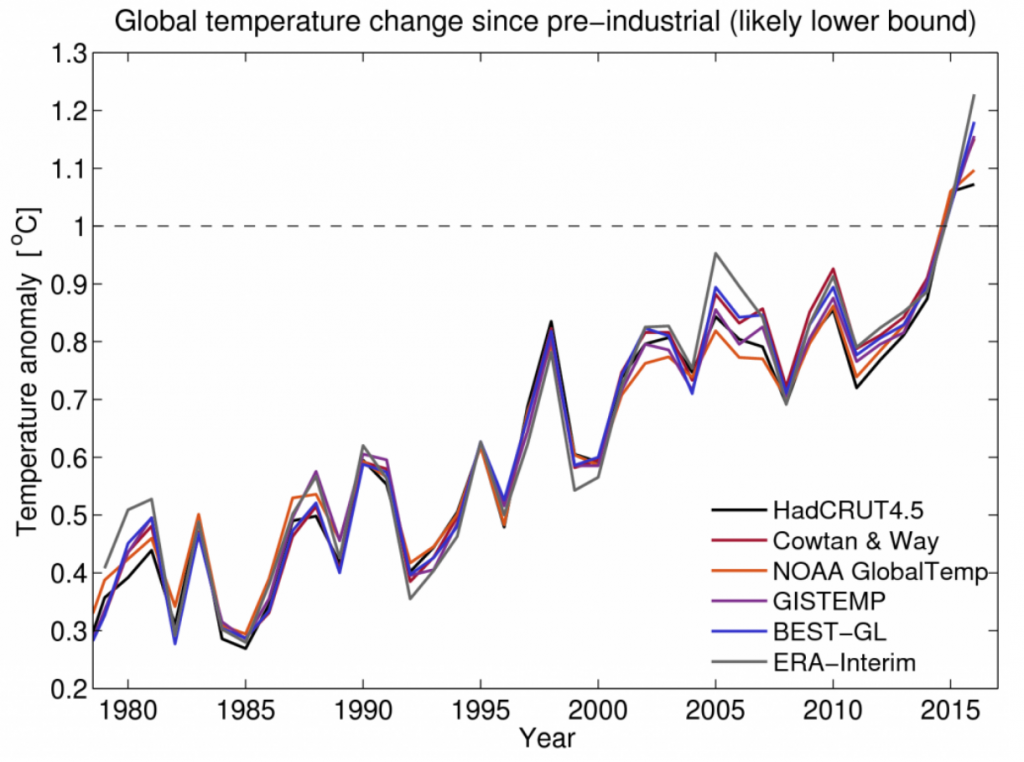 |
Figure 7: Global, annual, mean surface temperature relative to mean temperature during pre-industrial era (1720 - 1800), or relative to mean temperature from 1986 - 2005 in the case of ERA-Interim [99], as shown in multiple temperature analyses. Pre-2016 data came from a previous scientific publication [99], with later data added in a subsequent work [201]. |
 | ||
Figure 8: RSS near-global mid- to upper tropospheric temperature, with trend-lines for different 18 year periods [60].
|

Figure 6 shows that the short-term temperature trend that begins with a strong El Niño (solid green line in figure 6) under-estimates the long-term warming trend (dotted black line in figure 6) [75], in accordance with the IPCC's aforementioned assessment [152, page 194]. Figure 8 also shows how one's start point and end-point greatly impact the magnitude of the short-term trend [60]. For example, one can follow Monckton et al.'s example and have a strong El Niño year near one's chosen start point, while not having an El Niño near one's end-point [30, figure 8 on page 1386]. Such blatant cherry-picking allows Monckton et al. to generate and exploit a non-representative, short-term trend; this is analogous to choosing the short-term green trend in figure 6, over the long-term black trend in figure 6.
Figures 6 to 9 also show that 2016 was warmer, on average, than 1998. One might object that figure 4 from section 3.3 [60] shows that 2016 is not warmer than 1997-1998. However, this objection is incorrect. Figure 4 depicts upper tropospheric warming in the tropics. When one examines the near-global upper tropospheric trend, then it becomes clear that 2016 was warmer, on average, than 1998:
| Figure 10: Near-global mid- to upper tropospheric temperature averaged for the UAH, NOAA, and RSS analyses [243]. |
So figures 6 to 10 show a warming trend from 1998 to 2016 [60, 90, 201]. Once again, this warming trend is not wholly attributable to ENSO, since the El Niño of 2015-2016 was about as strong as (or weaker than [295]) the El Niño of 1997-1998 in terms of warming of the ocean surface [150] (with the 2015-2016 El Niño having less ocean warming in some regions, and greater ocean warming in other regions, than did the 1997-1998 El Niño [253, figure 2; 254]). So if one wanted to investigate the underlying global warming trend, then comparing 1998 to any subsequent year other than an equally strong El Niño year (such as 2016) would be misleading, since ENSO would skew the start point for that short-term trend. This confirms that the global warming trend remains even after correcting for ENSO, as shown in other sources [157 - 164].
The underlying global warming trend is largely caused by CO2. To see why, first note that since the 1800s, atmospheric CO2 levels increased in a roughly exponential manner [234; 235; 236, page 3]. Given the logarithmic relationship between increased CO2 and increased temperature [1, pages 736 and 740; 232; 233], this near-exponential increase in CO2 caused a near-linear CO2-induced warming trend [157; 166; 230 - 233; 240 - 242], though the linearity breaks down in extreme cases [288]. Short-term variability (from factors such as ENSO) and chance / statistical noise temporarily augmented or mitigated this near-linear CO2-induced warming trend [157; 233; 240], as depicted in figures 6, 8, and 9. Figure 10b depicts the linear warming trend more clearly, with much of the short-term variability removed [157]:
 |
Figure 11: (a) Global surface temperature trend from 1856 - 2010 after correcting for TSI (total solar irradiance, a measure of the solar radiation reaching Earth), ENSO, and volcanic aerosols. The upper-left, boxed inset depicts a measurement of the Atlantic multi-decadal oscillation (AMO), a cycle that affects ocean temperatures. (b) Global surface temperature trend after correcting for the AMO, TSI, ENSO, and volcanic aerosols [157]. It unclear whether the AMO is an independent cause of ocean warming vs. the AMO being a type of ocean warming caused by other factors [277; 279; 281; 316; 320, page 171]. There is also some dispute over whether the AMO impacts temperature as strongly as is shown panel (b) [269; 321]. For instance, aerosols, instead of just the AMO, may have partially offset CO2-induced warming during the 1940s to 1970s [7; 8, pages 1328 and 1329; 52; 97, from 40:29 to 45:59; 279; 313, section 1; 314, page 5827; 315; 318; 324; 331, as per 332, section 26.2; 341]. Some sources attribute much of the recent warming to the AMO [157; 270; 271], while other sources argue that the AMO does not account for much of the recent warming [177; 272; 273; 312; 321]. In either case, greenhouse gases such as CO2 substantially contributed to recent global warming [269; 274 - 281; 312]. And since the post-1964 multi-decadal global warming trend extends over more than 50 years [244; 282; 297; 333, figure 1b; 334, page S17; 335, generated using 336, as per 337], the 30-year increasing portion of the roughly 60-year AMO cycle may not account for such a long warming trend. |
So it would be misleading to cherry-pick a short period of mitigated global warming, in order to argue against estimate sof the long-term CO2-induced warming trend. But this fact did not stop Monckton et al. from cherry-picking a two-decade long period of reduced global warming, in order to argue against GCM-based projections of CO2-induced warming [24; pages 122 and 127; 30, pages 1379, 1385, and 1387]. Monckton et al.'s cherry-picking does not change the fact that global warming has occurred over the past two decades, nor does it change the fact that short-term temperature fluctuations should not undermine confidence in GCM-based temperature predictions. Monckton et al.'s cherry-picking also fails to support their CS estimate. Instead, incorporating the recent warming period still supports higher CS estimates [156; 246; 247], even if one does not take into account all of the other factors that cause CS to be under-estimated (factors I discussed in section 3.1).
3.5 Misattributing global warming to increased heat from urban development
Monckton et al. suggest that urbanization warmed much of the Earth surface. This is known as the urban heat-island effect (UHI). According to Monckton et al., some scientists then attributed this non-climatic warming to anthropogenic greenhouse gases, resulting in over-estimation of the warming caused by anthropogenic greenhouse gases [30, pages 1380 and 1382]. Monckton et al. support their claim [30, page 1382] by citing Michaels [267, pages 9 - 11; 268] and McKitrick's research correlating economic growth with warming [262]. However, other scientists critiqued Michaels and McKitrick's work, suggesting that their correlations were spurious [263; 264; 265, pages 25 to 30]. So Michaels and McKitrick's research may not provide a solid basis for claiming that UHI strongly biased measurements of CO2-induced global warming. When scientists examine other lines of evidence, it becomes clear that UHI does not strongly bias the surface temperature record. This can be shown through a number of means, including:
Thus Monckton et al. were wrong when they suggested that UHI caused much of the recent surface warming and that UHI substantially contributed to over-estimation of the magnitude of anthropogenic global warming [30, pages 1380 and 1382]. Monckton et al. will need to find some other way of reducing the surface warming trend in way that fits with their low CS estimate.
- Scientists use homogenization to correct for UHI. Homogenization is a process for correcting inhomogeneities, which are factors that artificially skew temperature records. I discuss and defend homogenization further in section 3.1 of "John Christy, Climate Models, and Long-term Tropospheric Warming". When one corrects for UHI using homogenization, there is still statistically significant surface warming and most of the observed surface warming remains [206; 208; 210; 212; 217 - 219; 343; 344].
- The global warming trend is often not significantly higher in urban areas vs. rural areas [204; 205; 216; 220, figure 4 on page 2153; 342; 344; 355]. When there is a significant difference, homogenization can correct for this urbanization-induced difference [206; 208; 210 - 214; 218; 344]. And much of the intense global warming occurs in non-urban, desertified areas [259; 260; 284 - 286; 293] in response to CO2-induced warming [284 - 286], or in non-urban areas in the Arctic [289 - 292]. Therefore UHI would not strongly bias these intense warming trends.
- Wind mitigates the effect of UHI. So if UHI was responsible for much of the long-term warming, then there should be a large discrepancy in the temperature record for windy areas vs. non-windy areas. However, this predicted difference is not observed [208; 209; 227]. Thus UHI is not responsible for much of the long-term warming trend.
- Scientists can validate and constrain land surface temperature records using other data sources [244; 305; 310; 343]. For example, satellite-based skin temperature analyses confirm the surface warming trend [345; conference paper for: 346], as do proxy-based estimates [305; 310; 347 - 352], and other indirect estimates that do not use instrumental surface temperature data [244; 347, figure 4; 353, using 336, as per 337, with the re-analyses from 244 and 354]. Moreover, UHI should not significantly bias ocean temperature records since oceans are not urban. And ocean warming should be less than land warming [97, from 31:47 to 33:33; 248 - 252; 257; 258], since oceans have a greater heat capacity than land. Ocean surface warming thus sets a UHI-independent lower limit for land surface warming. Scientists can also use climate models to predict the ratio of ocean surface warming to land surface warming [97, from 31:47 to 33:33; 248 - 252; 257; 258]. This ratio provides an UHI-independent upper limit for land surface warming. Land surface warming should significantly exceed this limit, if UHI substantially biased the land surface warming trend. Yet land surface warming is within this upper limit [250; 252, figure 4; 257, table 1; 258]. This provides further confirmation that UHI has not substantially biased the global surface warming trend.
- The lukewarmer Anthony Watts argued that artificial heat from urban sources biased the temperature record of poorly run American temperature stations [226]. So scientists at BEST (the Berkeley Earth Surface Temperature group) examined the warming trends in rural temperature stations approved of Watts vs. temperature stations Watts objected to. If UHI was responsible for much of the recent surface warming, then the warming trend in the rural stations should be significantly lower than the warming trend in the other stations. Yet the scientists observed no statistically significant difference between the two warming trends [204; 207]. This evidence, along with additional lines of evidence, changed the mind of Richard Muller, one of the BEST scientists performing this UHI research [203; 309]. In contrast, BEST's evidence did not change Watts' mind, despite the Watts' claim that he would accept BEST's results even if BEST's evidence showed Watts was wrong [221 - 224]. And Watts' mind still did not change, even when research (including research Watts himself co-authored [225; 296]) showed a similar warming trend for average temperature at stations Watts approved of vs. stations Watts objected to [207; 215; 225; 296] (a pattern similar to that observed in other regions of the world [204; 218]). This exemplifies Watts' habit of evading, and not changing his mind in response to, evidence that shows he is wrong (for further examples of Watts' habit, see section 3.2 of "John Christy, Climate Models, and Long-term Tropospheric Warming", along with section 3.1 of part 1 and section 3.4 of part 2 of my series on "John Christy and the Tropical Tropospheric Hot Spot"). Watts unwillingness to change his mind is a classic sign of a denialism, in contrast to scientific skeptics who change their mind in response to evidence [202; 266; 300, page 96; 301; 302; 308].
- Take one of the worst cases of UHI: China [212; 213; 217 - 219; 261]. UHI may account for up to around a third of the surface warming trend in China [217; 219; 228], according to research cited by Watts [229]. A number of scientists have shown that this number likely over-estimates UHI's contribution to China's surface warming record [212; 213; 218; 261; 344]. But, for the sake of argument, suppose one accepts that UHI caused roughly a third of China's surface warming trend. And then suppose one removes this estimated UHI-induced warming from the Chinese warming trend. Then China's warming trend closely matches the average global warming trend [219]. So China, one of the worst cases of UHI, gives one little reason for thinking that UHI substantially skews the average, homogenized, global warming trend [219].
Thus Monckton et al. were wrong when they suggested that UHI caused much of the recent surface warming and that UHI substantially contributed to over-estimation of the magnitude of anthropogenic global warming [30, pages 1380 and 1382]. Monckton et al. will need to find some other way of reducing the surface warming trend in way that fits with their low CS estimate.
4. References
- "The equilibrium sensitivity of the Earth’s temperature to radiation changes"
- "Feedbacks, climate sensitivity and the limits of linear models"
- "Climate change 2007: Working Group I: The physical science basis; Section 8.6.2.1: Definition of climate sensitivity"
- "Climate sensitivity in the geologic past"
- "Recent progress in constraining climate sensitivity with model ensembles"
- "Variation in climate sensitivity and feedback parameters during the historical period"
- "Implications for climate sensitivity from the response to individual forcings"
- "The myth of the 1970s global cooling scientific consensus"
- "The idea of anthropogenic global climate change in the 20th century"
- "A practical philosophy of complex climate modelling"
- "Climate change 2007: Working Group I: The physical science basis; Section 8.8: Climate models and their evaluation"
- "A risk model for prediction of lung cancer"
- "The LLP risk model: an individual risk prediction model for lung cancer"
- "History of analytical orbit modeling in the US space surveillance system"
- "The science: Orbital mechanics"
- "Lukewarming: The new climate science that changes everything"
- "The lukewarmers don’t deny climate change. But they say the outlook’s fine"
- "The lukewarmer's way"
- "Why are people skeptical about climate change? Some insights from blog comments" (doi:10.1080/17524032.2014.999694)
- "My life as a climate lukewarmer"
- "Making the lukewarmer case"
- "Lukewarmerism, a.k.a. ignoring inconvenient evidence"
- https://andthentheresphysics.wordpress.com/2014/03/09/lukewarmers/
- "Why models run hot: results from an irreducibly simple climate model"
- "Prominent signers of "An evangelical declaration on global warming""
- "An evangelical declaration on global warming"
- "Corrigendum to ‘A review of Holocene solar-linked climatic variation on centennial to millennial timescales: Physical processes, interpretative frameworks and a new multiple cross-wavelet transform algorithm’ Earth Sci. Rev. 134 [1–15]"
- "Stormy times for climate research"
- "Misdiagnosis of Earth climate sensitivity based on energy balance model results"
- "Keeping it simple: the value of an irreducibly simple climate model"
- "On the misdiagnosis of surface temperature feedbacks from variations in Earth’s radiant energy balance"
- "Does the Earth have an adaptive infrared iris?"
- potholer54's video: "2. Climate Change -- the objections"
- "On the observational determination of climate sensitivity and its implications"
- "On the determination of climate feedbacks from ERBE data"
- https://wattsupwiththat.com/2012/01/11/monckton-responds-to-potholer54/
- potholer54's video: "Monckton responds (part 1/2)"
- potholer54's video: "Monckton responds (part 2/2)"
- potholer54's video: "Monckton Bunkum Part 1 - Global cooling and melting ice"
- potholer54's video: "Monckton Bunkum Part 2 - Sensitivity"
- potholer54's video: "Monckton Bunkum Part 3 - Correlations and Himalayan glaciers"
- potholer54's video: "Monckton Bunkum Part 4 -- Quotes and misquotes"
- potholer54's video: "Monckton bunkum Part 5 -- What, MORE errors, my lord?"
- potholer54's video: "Response to "The Global Warming Hoax Lord Monckton & Stefan Molyneux"
- https://bbickmore.wordpress.com/lord-moncktons-rap-sheet/
- potholer54's video: "Open letter to Christopher Monckton -- Please return to the debate"
- potholer54's video: "Correcting misinformation about a face-to-face debate"
- http://variable-variability.blogspot.com/2016/07/climate-sensitivity-energy-balance-models.html
- "Reconciled climate response estimates from climate models and the energy budget of Earth"
- "Implications for climate sensitivity from the response to individual forcings"
- "Implications of potentially lower climate sensitivity on climate projections and policy"
- "Disentangling greenhouse warming and aerosol cooling to reveal Earth’s climate sensitivity"
- "Inhomogeneous forcing and transient climate sensitivity"
- "On a minimal model for estimating climate sensitivity"
- "Corrigendum to "On a minimal model for estimating climate sensitivity" [Ecol. Model. 297 (2015), 20-25]"
- "Inference of climate sensitivity from analysis of Earth's energy budget"
- "Projection and prediction: Climate sensitivity on the rise"
- "Sensitivity of satellite-derived tropospheric temperature trends to the diurnal cycle adjustment"
- "Removing diurnal cycle contamination in satellite-derived tropospheric temperatures: understanding tropical tropospheric trend discrepancies"
- "Comparing tropospheric warming in climate models and satellite data"
- "Tropospheric temperature trends: history of an ongoing controversy"
- "Executive summary: Temperature trends in the lower atmosphere - Understanding and reconciling differences"
- "Contribution of stratospheric cooling to satellite-inferred tropospheric temperature trends"
- "Satellite-derived vertical dependence of tropical tropospheric temperature trends"
- "A response to the “Data or Dogma?” hearing"
- "Extended Summary of the Climate Dialogue on the (missing) tropical hot spot"
- "Discrepancies in tropical upper tropospheric warming between atmospheric circulation models and satellites"
- "A comparative analysis of data derived from orbiting MSU/AMSU instruments"
- "A bias in the midtropospheric channel warm target factor on the NOAA-9 Microwave Sounding Unit"
- "Reply to “Comments on 'A bias in the midtropospheric channel warm target factor on the NOAA-9 Microwave Sounding Unit'"
- "The reproducibility of observational estimates of surface and atmospheric temperature change"
- "Atmospheric changes through 2012 as shown by iteratively homogenized radiosonde temperature and wind data (IUKv2)"
- "New estimates of tropical mean temperature trend profiles from zonal mean historical radiosonde and pilot balloon wind shear observations"
- "Estimating low-frequency variability and trends in atmospheric temperature using ERA-Interim"
- "A reassessment of temperature variations and trends from global reanalyses and monthly surface climatological datasets"
- "MERRA-2: Initial evaluation of the climate"
- http://www.realclimate.org/index.php/archives/2016/05/comparing-models-to-the-satellite-datasets/?wpmp_tp=1
- https://skepticalscience.com/graphics.php?g=243
- "How well do we know recent climate trends at the tropical tropopause?"
- "Reexamining the warming in the tropical upper troposphere: Models versus radiosonde observations"
- "Assessment of the first consensus prediction on climate change"
- "Test of a decadal climate forecast"
- "Climate change 2013: Working Group I: The physical science basis; Chapter 10; Detection and attribution of climate change: from global to regional"
- "Global temperature change"; doi: 10.1073/pnas.0606291103
- https://tamino.wordpress.com/2014/03/21/hansens-1988-predictions/
- https://skepticalscience.com/Hansen-1988-prediction-advanced.htm
- http://www.realclimate.org/index.php/archives/2007/05/hansens-1988-projections/
- https://bbickmore.wordpress.com/2010/08/17/the-monckton-files-a-bold-monckton-prediction/
- https://www.skepticalscience.com/ipcc-overestimate-global-warming-advanced.htm
- http://www.realclimate.org/index.php/archives/2009/05/moncktons-deliberate-manipulation/
- "Climate change 2013: Working Group I: The physical science basis; Chapter 12; Long-term climate change: Projections, commitments and irreversibility"
- "Climate change 2013: Working Group I: The physical science basis; Annex I: Atlas of global and regional climate projections, Supplementary material RCP8.5"
- "RCP 8.5—A scenario of comparatively high greenhouse gas emissions"
- "Carbon emission limits required to satisfy future representative concentration pathways of greenhouse gases"
- "Climate model: Temperature change (RCP 8.5) - 2006 - 2100"
- "World population stabilization unlikely this century"
- Ray Pierrehumbert's 2012 video: "Tyndall Lecture: GC43I. Successful Predictions - 2012 AGU Fall Meeting"
- "Data or dogma? Promoting open inquiry in the debate over the magnitude of human impact on Earth’s climate. Archived webcast of hearing before the U.S. Senate Committee on Commerce, Science, and Transportation, Subcommittee on Space, Science, and Competitiveness, 8 December 2015"
- "Estimating changes in global temperature since the pre-industrial period"
- "Global temperature evolution: recent trends and some pitfalls"
- "Coverage bias in the HadCRUT4 temperature series and its impact on recent temperature trends"
- Hansen et al.: "Global temperature in 2015"
- "Assessing recent warming using instrumentally homogeneous sea surface temperature records"
- "Unabated planetary warming and its ocean structure since 2006"
- "Tracking ocean heat uptake during the surface warming hiatus"
- "Assessing the impact of satellite-based observations in sea surface temperature trends"
- "A review of global ocean temperature observations: Implications for ocean heat content estimates and climate change"
- "Possible artifacts of data biases in the recent global surface warming hiatus"
- "Land surface temperature over global deserts: Means, variability, and trends"
- "On the definition and identifiability of the alleged “hiatus” in global warming"
- "Global land-surface air temperature change based on the new CMA GLSAT dataset"
- "Anthropogenic and natural warming inferred from changes in Earth’s energy balance"
- "Insights into Earth’s Energy imbalance from multiple sources"
- Stephens and L'Ecuyer: "The Earth's energy balance"; doi: 10.1016/j.atmosres.2015.06.024
- "Ozone depletion, greenhouse gases, and climate change"
- "Trace gas trends and their potential role in climate change"
- "A hiatus in the stratosphere?"
- "Isolating the roles of different forcing agents in global stratospheric temperature changes using model integrations with incrementally added single forcings"
- "Stratospheric temperature climate data record from merged SSU and AMSU-A observations"
- "Stratospheric temperature trends over 1979–2015 derived from combined SSU, MLS, and SABER satellite observations"
- "Stratospheric ozone change and related climate impacts over 1850–2100 as modelled by the ACCMIP ensemble"
- "The impact of ozone-depleting substances on tropical upwelling, as revealed by the absence of lower-stratospheric cooling since the late 1990s"
- "Attributing the forced components of observed stratospheric temperature variability to external drivers"
- "Identifying human influences on atmospheric temperature"
- "Human and natural influences on the changing thermal structure of the atmosphere"
- "Towards a physical understanding of stratospheric cooling under global warming through a process-based decomposition method"
- "Stratospheric temperature changes during the satellite era"
- "The ozone story: A model for addressing climate change?"
- "Depletion of the ozone layer in the 21st Century"
- "The Antarctic ozone hole: An update"
- "Antarctic ozone loss in 1979–2010: first sign of ozone recovery"
- "Quantifying the ozone and ultraviolet benefits already achieved by the Montreal Protocol"
- "Evidence for the effectiveness of the Montreal Protocol to protect the ozone layer"
- "Emergence of healing in the Antarctic ozone layer"
- "Models versus radiosondes in the free atmosphere: A new detection and attribution analysis of temperature"
- "Sensitivity of surface-temperature and atmospheric-temperature to perturbations in stratospheric concentration of ozone and nitrogen-dioxide"
- "Evidence for an earlier greenhouse cooling effect in the stratosphere before 1980 over the Northern Hemisphere"
- "Regional and seasonal stratospheric temperature trends in the last decade (2002–2014) from AMSU observations"
- "A method for merging nadir-sounding climate records, with an application to the global-mean stratospheric temperature data sets from SSU and AMSU"
- "Linear trends and closures of 10-yr observations of AIRS stratospheric channels"
- "The stratospheric changes inferred from 10 years of AIRS and AMSU-A radiances"
- "The JRA-55 reanalysis: Representation of atmospheric circulation and climate variability"
- "The JRA-55 reanalysis: General specifications and basic characteristics"
- "Tropopause height and zonal wind response to global warming in the IPCC scenario integrations"
- "The greenhouse theory of climate change: A test by an inadvertent global experiment"
- "Global climate changes as forecast by Goddard Institute for Space Studies three-dimensional model"
- "Long-term temperature trends in the stratosphere: Possible influence of anthropogenic gases"
- "Major greenhouse cooling (yes, cooling): The upper atmosphere response to increased CO2"
- "Observational determination of surface radiative forcing by CO2 from 2000 to 2010"
- "Ranking the strongest ENSO events while incorporating SST uncertainty"
- potholer54's video: "Why global temperatures never go up in straight lines"
- "Climate change 2013: The physical science basis; Chapter 2: Observations: Atmosphere and Surface"
- "Overcoming endpoint bias in climate change communication: The case of arctic sea ice trends"
- "Debunking the climate hiatus"
- "Sensitivity to factors underlying the hiatus"
- "Natural variability, radiative forcing and climate response in the recent hiatus reconciled"
- "Deducing multidecadal anthropogenic global warming trends using multiple regression analysis"
- "Global temperature evolution 1979–2010"
- "Volcanic contribution to decadal changes in tropospheric temperature"
- "Clarifying the roles of greenhouse gases and ENSO in recent global warming through their prediction performance"
- "Spectrally dependent CLARREO infrared spectrometer calibration requirement for climate change detection"
- https://tamino.wordpress.com/2016/01/29/correcting-for-more-than-just-el-nino/
- http://www.skepticalscience.com/graphics.php?g=67
- http://www.politicalowl.com/home/wp-content/uploads/2014/12/2014-12-04_influenceof-nino-and-nina.jpg
- "Well-estimated global surface warming in climate projections selected for ENSO phase"
- "The global warming hiatus — a natural product of interactions of a secular warming trend and a multi-decadal oscillation"
- "Forcing, feedback and internal variability in global temperature trends"
- "Decadal climate variability and the early-2000s hiatus"
- "Investigating the recent apparent hiatus in surface temperature increases: 2. Comparison of model ensembles to observational estimates"
- "Apparent limitations in the ability of CMIP5 climate models to simulate recent multi-decadal change in surface temperature: implications for global temperature projections"
- "Externally forced and internally generated decadal climate variability associated with the interdecadal pacific oscillation"
- "Contribution of the Interdecadal Pacific Oscillation to twentieth-century global surface temperature trends"
- "The tropical Pacific as a key pacemaker of the variable rates of global warming"
- "Observations of climate feedbacks over 2000–10 and comparisons to climate models"
- "Climate model simulations of the observed early-2000s hiatus of global warming"
- "Role of volcanic and anthropogenic aerosols in the recent global surface warming slowdown"
- "Atlantic and Pacific multidecadal oscillations and Northern Hemisphere temperatures"
- "Decadal modulation of global surface temperature by internal climate variability"
- "Atmospheric footprint of the recent warming slowdown"
- http://variable-variability.blogspot.co.uk/2017/04/hiatus-signal-and-variability.html
- http://variable-variability.blogspot.co.uk/2015/03/how-can-pause-be-both-false-and-caused.html
- http://www.meteo.psu.edu/holocene/public_html/Mann/articles/articles/MannSciAmApr14.pdf
- "Lack of evidence for a slowdown in global temperature"
- "The “pause” in global warming: turning a routine fluctuation into a problem for science"
- "Making sense of the early-2000s warming slowdown"
- "The global warming hiatus: Slowdown or redistribution?"
- "Has there been a hiatus?"
- "An apparent hiatus in global warming?"
- "Change points of global temperature"
- "Determining the likelihood of pauses and surges in global warming"
- "Drivers of decadal hiatus periods in the 20th and 21st centuries"
- "Recent global temperature “plateau” in the context of a new proxy reconstruction"
- "Is the climate warming or cooling?"
- S. Lovejoy: "Climate closure"
- "Analysis of the ENSO signal in tropospheric and stratospheric temperatures observed by MSU, 1979–2000"
- "Is the Sun causing global warming?"
- http://climate.nasa.gov/causes/
- "Comment on “Climate Science and the Uncertainty Monster” by J. A. Curry and P. J. Webster"
- "Climate change 2007: The physical science basis; Chapter 9: Understanding and attributing climate change"
- "On the detection of the solar signal in the tropical stratosphere"
- "Guest post: The challenge of defining the ‘pre-industrial’ era"
- "How the growth of denialism undermines public health"
- "Richard Muller: I Was wrong on Climate Change"
- "Influence of urban heating on the global temperature land average using rural sites identified from MODIS classifications"
- "Global rural temperature trends"
- "Quantifying the effect of urbanization on U.S. Historical Climatology Network temperature records"
- "Earth atmospheric land surface temperature and station quality in the contiguous United States"
- "Urban heat island effects on estimates of observed climate change"
- "A demonstration that large-scale warming is not urban"
- "Assessment of urban versus rural in situ surface temperatures in the contiguous United States: No difference found"
- "Urban and rural temperature trends in proximity to large US cities: 1951–2000"
- "Urbanization effects in large-scale temperature records, with an emphasis on China"
- "Urbanization-related warming in local temperature records: a review"
- "Evaluating the impact of U.S. Historical Climatology Network homogenization using the U.S. Climate Reference Network"
- "On the reliability of the U.S. surface temperature record"
- "The effects of urbanization on the rise of the European temperature since 1960"
- "Urbanization effects on observed surface air temperature trends in north China"
- "Correcting urban bias in large-scale temperature records in China, 1980–2009"
- "Contribution of urbanization to warming in China"
- "An analysis on the urban heat island effect using radiosonde profiles and Landsat imagery with ground meteorological data in south Florida"
- https://wattsupwiththat.com/2011/03/06/briggs-on-berkeleys-best-plus-my-thoughts-from-my-visit-there/ [http://archive.is/B6crm#selection-605.0-617.154]
- https://www.skepticalscience.com/WattsandBEST.html [http://archive.is/F8qx2]
- "Climate skeptics stay unswayed" [http://archive.is/3EUG]
- "The 2011 climate B.S.* of the year awards"
- "Analysis of the impacts of station exposure on the U.S. Historical Climatology Network temperatures and temperature trends"
- "Is the U.S. surface temperature record reliable?"
- "Climate: Large-scale warming is not urban"
- "Observed surface warming induced by urbanization in east China"
- https://wattsupwiththat.com/2011/07/28/new-paper-uhi-alive-and-well-in-china/
- "The origin and limits of the near proportionality between climate warming and cumulative CO2 emissions"
- "Sensitivity of climate to cumulative carbon emissions due to compensation of ocean heat and carbon uptake"
- "Return periods of global climate fluctuations and the pause"
- https://skepticalscience.com/C02-emissions-vs-Temperature-growth.html
- "Atmospheric CO2 over the last 1000 years: A high-resolution record from the West Antarctic Ice Sheet (WAIS) Divide ice core"
- "Climate change 2007: Working Group I: The physical science basis; FAQ 2.1: "How do human activities contribute to climate change and how do they compare with natural influences?"
- "Climate change 2014: Synthesis report; Summary for policymakers"
- "Use of SSU/MSU satellite observations to validate upper atmospheric temperature trends in CMIP5 simulations"
- https://agwobserver.wordpress.com/2017/01/17/global-warming-hiatus-claims-prebunked-in-1980s-and-1990s/
- "An apparent moratorium on the greenhouse warming due to the deep ocean"
- "Using data to attribute episodes of warming and cooling in instrumental records"
- "The proportionality of global warming to cumulative carbon emissions"
- "The sensitivity of the proportionality between temperature change and cumulative CO2 emissions to ocean mixing"
- "Tropospheric warming over the past two decades"
- "Independent confirmation of global land warming without the use of station temperatures"
- http://images.remss.com/msu/msu_time_series.html (accessed June 5, 2017)
- "Equilibrium climate sensitivity in light of observations over the warming hiatus"
- "Reply to 'Volcanic effects on climate'"
- "Transient responses of a coupled ocean–atmosphere model to gradual changes of atmospheric CO2. Part I. Annual mean response"
- "An analogue model to derive additional climate change scenarios from existing GCM simulations"
- "Land/sea warming ratio in response to climate change: IPCC AR4 model results and comparison with observations"
- "Mechanisms for the land/sea warming contrast exhibited by simulations of climate change"
- "Communicating global climate change using simple indices: an update"
- "The 2015/2016 El Niño event in context of the MERRA-2 reanalysis: A comparison of the tropical Pacific with 1982/1983 and 1997/1998"
- "Observing and predicting the 2015-16 El Niño"
- "Robust comparison of climate models with observations using blended land air and ocean sea surface temperatures"
- potholer54's video: "7. Climate Change - "Those" e-mails and science censorship"
- "Control of land-ocean temperature contrast by ocean heat uptake"
- "Land–ocean warming contrast over a wide range of climates: Convective quasi-equilibrium theory and idealized simulations"
- "Observational evidence for desert amplification using multiple satellite datasets"
- "Detection and analysis of an amplified warming of the Sahara Desert"
- "Urban heat island effect on annual mean temperature during the last 50 years in China"
- "Quantifying the influence of anthropogenic surface processes and inhomogeneities on gridded global climate data"
- "Spurious correlations between recent warming and indices of local economic activity"
- "Are temperature trends affected by economic activity? Comment on McKitrick & Michaels (2004)"
- "Climate change & tropospheric temperature trends, Part II - A critical examination of skeptic claims"
- "Sceptics and deniers of climate change not to be confused"
- "Climate Denial 101: A User’s Guide to the arguments of global warming skeptics"
- https://skepticalscience.com/patrick-michaels-history-getting-climate-wrong.html
- "Impact of the Atlantic Multidecadal Oscillation (AMO) on deriving anthropogenic warming rates from the instrumental temperature record"
- "Climate variability during warm and cold phases of the Atlantic Multidecadal Oscillation (AMO) 1871–2008"
- "Anthropogenic CO2 warming challenged by 60-year cycle"
- "On forced temperature changes, internal variability, and the AMO"
- "Tracking the Atlantic Multidecadal Oscillation through the last 8,000 years"
- "The Atlantic Multidecadal Oscillation as a dominant factor of oceanic influence on climate"
- "The role of Atlantic Multi-decadal Oscillation in the global mean temperature variability"
- "The North Atlantic Oscillation as a driver of rapid climate change in the Northern Hemisphere"
- "The Atlanto-Pacific multidecade oscillation and its imprint on the global temperature record"
- "Imprints of climate forcings in global gridded temperature data"
- "North Atlantic Multidecadal SST Oscillation: External forcing versus internal variability"
- "Forced and internal twentieth-century SST trends in the North Atlantic"
- "Interactive comment on "Imprints of climate forcings in global gridded temperature data" by J. Mikšovský et al."
- "Internal variability in simulated and observed tropical tropospheric temperature trends"
- http://www.drroyspencer.com/2017/05/santer-takes-on-pruitt-the-global-warming-pause-and-the-devolution-of-climate-science/
- "Desert amplification in a warming climate"
- "Mechanisms for stronger warming over drier ecoregions observed since 1979"
- "Stronger warming amplification over drier ecoregions observed since 1979"
- "Response to Comment on "Contributions of Anthropogenic and Natural Forcing to Recent Tropopause Height Changes"
- "Feedback temperature dependence determines the risk of high warming"
- "The central role of diminishing sea ice in recent Arctic temperature amplification"
- "Understanding the mechanism of Arctic amplification and sea ice loss"
- "Processes and impacts of Arctic amplification: A research synthesis"
- "Amplified Arctic warming and mid‐latitude weather: new perspectives on emerging connections"
- "Seasonality of the observed amplified Sahara warming trend and implications for Sahel rainfall"
- http://images.remss.com/papers/rsstech/Jan_5_2017_news_release.pdf
- https://www.esrl.noaa.gov/psd/enso/mei/ (accessed June 12, 2017)
- https://wottsupwiththat.com/the-surfacestations-paper/
- "Improved estimates of ocean heat content from 1960 to 2015"
- "Industrial-era global ocean heat uptake doubles in recent decades"
- "In situ–based reanalysis of the global ocean temperature and salinity with ISAS: Variability of the heat content and steric height"
- "Debating global warming in media discussion forums: Strategies enacted by “persistent deniers” and implications for schooling"
- http://www.csicop.org/specialarticles/show/tributes_to_steve_schneider
- http://www.newstatesman.com/ideas/2008/09/evidence-sceptic-hiv-bogus
- "A satellite-derived lower tropospheric atmospheric temperature dataset using an optimized adjustment for diurnal effects"
- http://www.remss.com/blog/recent-slowing-rise-global-temperatures
- "A global multiproxy database for temperature reconstructions of the Common Era"
- "Reconciling estimates of ocean heating and Earth’s radiation budget"
- "Observed and simulated full-depth ocean heat-content changes for 1970–2005"
- http://www.csicop.org/news/show/deniers_are_not_skeptics
- "The conversion of a climate-change skeptic"
- "Global warming in an independent record of the past 130 years"
- "The spectral signature of recent climate change"
- "A new estimate of the average Earth surface land temperature spanning 1753 to 2011"
- "Climate variability and relationships between top-of-atmosphere radiation and temperatures on Earth"
- "Ocean mediation of tropospheric response to reflecting and absorbing aerosols"
- "Radiative forcing in the ACCMIP historical and future climate simulations"
- "Low-pass filtering, heat flux, and Atlantic multidecadal variability"
- "The influence of internal variability on Earth's energy balance framework and implications for estimating climate sensitivity"
- "Significant aerosol influence on the recent decadal decrease in tropical cyclone activity over the western North Pacific: Aerosol influence on decadal TC activity"
- "Internal variability and disequilibrium confound estimates of climate sensitivity from observations"
- "Insights into Atlantic multidecadal variability using the Last Millennium Reanalysis framework"
- "Evidence for external forcing on 20th-century climate from combined ocean-atmosphere warming patterns"
- "Beyond equilibrium climate sensitivity"
- "Distinct global warming rates tied to multiple ocean surface temperature changes"
- "The influence of anthropogenic aerosol on multi-decadal variations of historical global climate"
- "Changes in global net radiative imbalance 1985–2012"
- "Skill and uncertainty in climate models"
- https://www.carbonbrief.org/analysis-how-well-have-climate-models-projected-global-warming
- https://twitter.com/hausfath/status/1010240647960264705
- http://www.realclimate.org/index.php/archives/2018/06/30-years-after-hansens-testimony/
- https://www.yaleclimateconnections.org/2018/06/judgment-on-hansens-88-climate-testimony-he-was-right/
- "Enlightening global dimming and brightening"
- "Global Warming (1970–Present)" [in "The Palgrave Handbook of Climate History", pages 321-328]
- "Recent United Kingdom and global temperature variations"
- "State of the climate in 2017"
- https://www.esrl.noaa.gov/psd/cgi-bin/data/testdap/timeseries.proc.pl?dataset1=NCEP%2FNCAR+R1&dataset2=none&var=Air+Temperature&level=300mb&pgT1Sel=10&pgtTitle1=&pgtPath1=&var2=Geopotential+Height&level2=1000mb&pgT2Sel=10&pgtTitle2=&pgtPath2=&fyear=1948&fyear2=2017&season=1&fmonth=0&fmonth2=11&type=1&climo1yr1=1981&climo1yr2=2010&climo2yr1=1981&climo2yr2=2010&xlat1=-30&xlat2=30&xlon1=0&xlon2=360&maskx=0&zlat1=0&zlat2=90&zlon1=0&zlon2=360&maskx2=0&map=0&yaxis=0&bar=0&smooth=0&runmean=1&yrange1=0&yrange2=0&y2range1=0&y2range2=0&xrange1=0&xrange2=0&markers=0&legend=0&Submit=Create+Plot
- "Web-based Reanalysis Intercomparison Tool: Monthly/seasonal time series" https://www.esrl.noaa.gov/psd/cgi-bin/data/testdap/timeseries.pl
- "Web-Based Reanalysis Intercomparison Tools (WRIT) for analysis and comparison of reanalyses and other datasets"
- "Climate change 2007: Working Group I: The physical science basis; Annex I: Glossary"
- "“Prediction” or “Projection”? The nomenclature of climate science"
- "Climate change 2014: Working Group I: The physical science basis; Annex II: Glossary"
- "Historical sulfur dioxide emissions 1850-2000: Methods and results"
- "Comment on “Unresolved issues with the assessment of multidecadal global land surface temperature trends” by Roger A. Pielke Sr. et al."
- "Urban heat island Assessment: Metadata are important"
- "Urbanization effects in large‐scale temperature records, with an emphasis on China"
- "Recent global warming as confirmed by AIRS"
- Conference paper: "Global surface skin temperature analysis from recent decadal IASI observations"
- "The last millennium climate reanalysis project: Framework and first results"
- "Reconstructing paleoclimate fields using online data assimilation with a linear inverse model"
- "Early onset of industrial-era warming across the oceans and continents" ["Corrigendum: Early onset of industrial-era warming across the oceans and continents"]
- "Global and hemispheric temperature reconstruction from glacier length fluctuations"
- "Causes of East Asian temperature multidecadal variability since 850 CE"
- "European summer temperatures since Roman times"
- https://www.esrl.noaa.gov/psd/cgi-bin/data/testdap/timeseries.proc.pl?dataset1=ERA-20C&dataset2=20th+Century+Reanalysis+V2&var=2m+Air+Temperature&level=1000mb&pgT1Sel=10&pgtTitle1=&pgtPath1=&var2=2m+Air+Temperature&level2=1000mb&pgT2Sel=10&pgtTitle2=&pgtPath2=&fyear=1890&fyear2=2015&season=1&fmonth=0&fmonth2=11&type=1&climo1yr1=1981&climo1yr2=2010&climo2yr1=1981&climo2yr2=2010&xlat1=-90&xlat2=90&xlon1=0&xlon2=360&maskx=0&zlat1=-90&zlat2=90&zlon1=0&zlon2=360&maskx2=0&map=on&yaxis=0&bar=0&smooth=0&runmean=1&yrange1=0&yrange2=0&y2range1=0&y2range2=0&xrange1=0&xrange2=0&markers=0&legend=0&ywave1=&ywave2=&cwavelow=&cwavehigh=&cwaveint=&coi=0&Submit=Create+Plot [http://archive.is/pRFIJ]
- "ERA-20C: An atmospheric reanalysis of the twentieth century"
- "GISS analysis of surface temperature change" (DOI: 10.1029/1999JD900835)
- "Evaluating the performance of past climate model projections" (Supplemental figures: https://agupubs.onlinelibrary.wiley.com/action/downloadSupplement?doi=10.1029%2F2019GL085378&file=grl59922-sup-0001-2019GL085378-SI.docx ; American Geophysical Union, December 2018 conference abstract: "Assessing the performance of historical climate model forecasts")
No comments:
Post a Comment