Translate

Friday, July 28, 2017

+Myth: Santer et al. Show that Climate Models are Very Flawed

The outline for this post is as follows:
  1. The Myth and Its Flaws
  2. Context and Analysis (divided into multiple sections)
  3. Posts Providing Further Information and Analysis
  4. References

This is the "+References" version of this post, which means that this post contains my full list of references and citations. If you would like an abbreviated and easier to read version, then please go to the "main version" of this post.

References are cited as follows: "[#]", with "#" corresponding to the reference number given in the References section at the end of this post.


1.  The Myth and Its Flaws


The climate scientist Ben Santer recently co-authored a paper on climate models [1]. In that paper, Santer and his co-authors showed that models over-estimated recent atmospheric warming, thereby revealing a deep flaw in the models. The climate models likely exaggerated carbon-dioxide-induced atmospheric warming, thus vindicating claims made by the climate scientist John Christy and United States senator Ted Cruz.

Myth: Santer et al. Show that Climate Models are Very Flawed

The outline for this post is as follows:
  1. The Myth and Its Flaws
  2. Context and Analysis (divided into multiple sections)
  3. Posts Providing Further Information and Analysis
  4. References

This is the "main version" of this post, which means that this post lacks most of my references and citations. If you would like a more comprehensive version with all the references and citations, then please go to the "+References" version of this post.

References are cited as follows: "[#]", with "#" corresponding to the reference number given in the References section at the end of this post.


1.  The Myth and Its Flaws


The climate scientist Ben Santer recently co-authored a paper on climate models. In that paper, Santer and his co-authors showed that models over-estimated recent atmospheric warming, thereby revealing a deep flaw in the models. The climate models likely exaggerated carbon-dioxide-induced atmospheric warming, thus vindicating claims made by the climate scientist John Christy and United States senator Ted Cruz.

Monday, July 24, 2017

+Myth: The Sun Caused Recent Global Warming and the Tropical Stratosphere Warmed

The outline for this post is as follows:
  1. The Myth and Its Flaws
  2. Context and Analysis (divided into multiple sections)
  3. Posts Providing Further Information and Analysis
  4. References

This is the "+References" version of this post, which means that this post contains my full list of references and citations. If you would like an abbreviated and easier to read version, then please go to the "main version" of this post.

References are cited as follows: "[#]", with "#" corresponding to the reference number given in the References section at the end of this post.


1.  The Myth and Its Flaws


The myth states that the tropical stratosphere, a layer of the middle atmosphere, warmed and that the Sun caused most of the recent global warming. 

Myth: The Sun Caused Recent Global Warming and the Tropical Stratosphere Warmed

The outline for this post is as follows:
  1. The Myth and Its Flaws
  2. Context and Analysis (divided into multiple sections)
  3. Posts Providing Further Information and Analysis
  4. References

This is the "main version" of this post, which means that this post lacks most of my references and citations. If you would like a more comprehensive version with all the references and citations, then please go to the "+References" version of this post.

References are cited as follows: "[#]", with "#" corresponding to the reference number given in the References section at the end of this post.


1.  The Myth and Its Flaws


The myth states that the tropical stratosphere, a layer of the middle atmosphere, warmed and that the Sun caused most of the recent global warming. 

Friday, July 21, 2017

+Myth: The Tropospheric Hot Spot does not Exist

This post is part of a series addressing issues related to the hot spot. The other parts of this series are listed in the "Myths about the Hot Spot" section of the "Quick Scientific Debunking" page.


The outline for this post is as follows:
  1. The Myth and Its Flaw
  2. Context and Analysis (divided into multiple sections)
  3. Posts Providing Further Information and Analysis
  4. References

This is the "+References" version of this post, which means that this post contains my full list of references and citations. If you would like an abbreviated and easier to read version, then please go to the "main version" of this post.

References are cited as follows: "[#]", with "#" corresponding to the reference number given in the References section at the end of this post.

The following twitter threads summarize some of the main points in this blogpost:
https://twitter.com/AtomsksSanakan/status/1013105778763468800
https://twitter.com/AtomsksSanakan/status/932649966383849474


1.  The Myth and Its Flaw


Climate models predict that in moist tropical areas, a region of the lower atmosphere will warm more than Earth's surface [10; 25, pages 4 and 22; 26, from 31:01 to 31:48; 27 - 30; 50; 52; 192; 216, pages 7 and 8; 217, pages 101 and 102; 236; 237; 241]. This region of greater warming is known as the "hot spot" [8; 16, pages 14 and 42; 31, page 6; 32]. The myth claims that there is little-to-no evidence of a hot spot, or the scientific evidence argues against the hot spot's existence.

Myth: The Tropospheric Hot Spot does not Exist

This post is part of a series addressing issues related to the hot spot. The other parts of this series are listed in the "Myths about the Hot Spot" section of the "Quick Scientific Debunking" page.


The outline for this post is as follows:
  1. The Myth and Its Flaw
  2. Context and Analysis (divided into multiple sections)
  3. Posts Providing Further Information and Analysis
  4. References

This is the "main version" of this post, which means that this post lacks most of my references and citations. If you would like a more comprehensive version with all the references and citations, then please go to the "+References" version of this post.

References are cited as follows: "[#]", with "#" corresponding to the reference number given in the References section at the end of this post.

The following twitter threads summarize some of the main points in this blogpost:
https://twitter.com/AtomsksSanakan/status/1013105778763468800
https://twitter.com/AtomsksSanakan/status/932649966383849474


1.  The Myth and Its Flaw


Climate models predict that in moist tropical areas, a region of the lower atmosphere will warm more than Earth's surface. This region of greater warming is known as the "hot spot". The myth claims that there is little-to-no evidence of a hot spot, or the scientific evidence argues against the hot spot's existence.

Tuesday, July 18, 2017

+Myth: The Tropospheric Hot Spot is a Fingerprint of CO2-induced Warming

This post is part of a series addressing issues related to the hot spot. The other parts of this series are listed in the "Myths about the Hot Spot" section of the "Quick Scientific Debunking" page.


The outline for this post is as follows:
  1. The Myth and Its Flaw
  2. Context and Analysis
  3. Posts Providing Further Information and Analysis
  4. References

This is the "+References" version of this post, which means that this post contains my full list of references and citations. If you would like an abbreviated and easier to read version, then please go to the "main version" of this post.

References are cited as follows: "[#]", with "#" corresponding to the reference number given in the References section at the end of this post.

The following twitter thread summarizes some of the main points in this blogpost: https://twitter.com/AtomsksSanakan/status/954013475470299136


1.  The Myth and Its Flaw


Climate models predict that in moist tropical areas, a region of the lower atmosphere will warm more than Earth's surface [10; 25, page 4; 26, from 31:01 to 31:48; 27 - 30; 81, pages 7 and 8; 82, pages 101 and 102; 102, section 3.4 on page 762; 114]. This region of greater warming is known as the "hot spot" [8; 16, pages 14 and 42; 33, page 6; 68; 114]. The myth states that the hot spot is a specific sign, or fingerprint, of anthropogenic (human-caused) carbon-dioxide-induced global warming.

Myth: The Tropospheric Hot Spot is a Fingerprint of CO2-induced Warming

This post is part of a series addressing issues related to the hot spot. The other parts of this series are listed in the "Myths about the Hot Spot" section of the "Quick Scientific Debunking" page.


The outline for this post is as follows:
  1. The Myth and Its Flaw
  2. Context and Analysis
  3. Posts Providing Further Information and Analysis
  4. References

This is the "main version" of this post, which means that this post lacks most of my references and citations. If you would like a more comprehensive version with all the references and citations, then please go to the "+References" version of this post.

References are cited as follows: "[#]", with "#" corresponding to the reference number given in the References section at the end of this post.

The following twitter thread summarizes some of the main points in this blogpost: https://twitter.com/AtomsksSanakan/status/954013475470299136


1.  The Myth and Its Flaw


Climate models predict that in moist tropical areas, a region of the lower atmosphere will warm more than Earth's surface. This region of greater warming is known as the "hot spot". The myth states that the hot spot is a specific sign, or fingerprint, of anthropogenic (human-caused) carbon-dioxide-induced global warming.

Monday, July 17, 2017

+Myth: El Niño Caused Post-1997 Global Warming

The outline for this post is as follows:
  1. The Myth and Its Flaw
  2. Context and Analysis
  3. Posts Providing Further Information and Analysis
  4. References

This is the "+References" version of this post, which means that this post contains my full list of references and citations. If you would like an abbreviated and easier to read version, then please go to the "main version" of this post.

References are cited as follows: "[#]", with "#" corresponding to the reference number given in the References section at the end of this post.


1.  The Myth and Its Flaw


El Niño, the warm phase of an ocean cycle known as the El Niño Southern Oscillation (ENSO), caused post-1997 global warming. Thus the recent warming is natural, as opposed to anthropogenic or caused by humans.

Purveyors of this myth include Roy Spencer [1], the Daily Caller [2], The Competitive Enterprise Institute [3], Leo Goldstein [4], Marc Morano [5], Pierre Gosselin on NoTricksZone [89], and David Wojick [25]. Spencer seems to be the primary purveyor of this myth, since other myth proponents typically cite Spencer [2 - 5].

Myth: El Niño Caused Post-1997 Global Warming

The outline for this post is as follows:
  1. The Myth and Its Flaw
  2. Context and Analysis
  3. Posts Providing Further Information and Analysis
  4. References

This is the "main version" of this post, which means that this post lacks most of my references and citations. If you would like a more comprehensive version with all the references and citations, then please go to the "+References" version of this post.

References are cited as follows: "[#]", with "#" corresponding to the reference number given in the References section at the end of this post.


1.  The Myth and Its Flaw


El Niño, the warm phase of an ocean cycle known as the El Niño Southern Oscillation (ENSO), caused post-1997 global warming. Thus the recent warming is natural, as opposed to anthropogenic or caused by humans.

Purveyors of this myth include Roy Spencer, the Daily Caller, The Competitive Enterprise Institute, Leo Goldstein, Marc Morano, Pierre Gosselin on NoTricksZone, and David Wojick. Spencer seems to be the primary purveyor of this myth, since other myth proponents typically cite Spencer.

The myth's flaw: Post-1997 global warming remains, even after one corrects for ENSO in both its warm El Niño phase and cool La Niña phase. Moreover, ~90% excess energy goes into warming the deeper ocean regions. This longer-term deep ocean warming continued post-1997, and is explained by factors other than El Niño, since El Niño transfers energy from the deeper oceans to the surface, leading to a very short-term drop in ocean heat content.


One should expect future contrarians/denialists to continue abusing anomalously warm years, including as El Niño years, in order to avoid acknowledging the magnitude of human-made global warming. This will likely involve contrarians/denialists doing at least one of the following: 
  1. if a temperature trend ends on an El Niño year, claim the warming trend is just due to El Niño or some other non-human-made factor
  2. cherry-pick temperature trends that have an El Niño at (or soon after) their beginning, and/or have a La Niña at (or soon before) their end, in order to claim global warming paused, stopped, etc.
  3. focus on shorter-term temperature trend fluctuations, instead of longer-term, multi-decadal time-scales at which the effect of human-made greenhouse-gas-induced warming becomes more apparent

Note that contrarians will likely use these strategies to emphasis periods where ENSO and/or other forms of natural variability temporarily decelerate a global warming trend, while conveniently downplaying times at which this natural variability temporarily accelerates the trend.

I address strategy 1 in this blogpost. I also discuss strategy 2 in section 3.4 of "John Christy, Climate Models, and Long-term Tropospheric Warming", https://twitter.com/AtomsksSanakan/status/998042024204013568, "Myth: No Global Warming for Two Decades".


2. Context and Analysis


During El Niño (also known as the El Niño phase of ENSO, the El Niño Southern Oscillation) the oceans' surface warms, as does a region of the lower atmosphere known as the troposphere. For this post, I will largely set aside the question of whether carbon-dioxide-induced (CO2-induced) global warming affects the frequency and intensity of ENSO events. I will instead focus on El Niño itself.

The strength of El Niño can be measured using the multivariate ENSO index, or MEI. Myth proponent Roy Spencer should be aware of this, since Spencer employed the MEI in his published research. MEI-corrected temperatures still show post-1997 global warming, as shown in published research and unpublished analyses. Thus El Niño did not cause the post-1997 global warming. Even Spencer's colleague John Christy admits that ENSO did not cause the post-1997 tropospheric warming trend (though Christy gets little else right when it comes to climate science). Figure 1 depicts some MEI-corrected temperature trends, illustrating that ENSO does not explain most of the multi-decadal warming:


Figure 1: Relative temperature from 1979 - 2010 for three surface temperature records (GISS, NCDC a.k.a. NOAA, and CRU) and two lower tropospheric temperature records (RSS and UAH), after correction for ENSO (using MEI), volcanic effects, and changes in solar irradiance [1].

Grant Foster, a co-author of this figure, updated its analysis with data through 2018. His results showed similar pattern of global warming, even after correction for ENSO, volcanic effects, and changes in solar irradiance.

Other studies yielded a similar result, as I discuss in section 2.3 of "Myth: The Sun Caused Recent Global Warming and the Tropical Stratosphere Warmed". Using the Southern Oscillation Index (SOI) as a measure of ENSO yields the same result as well. 

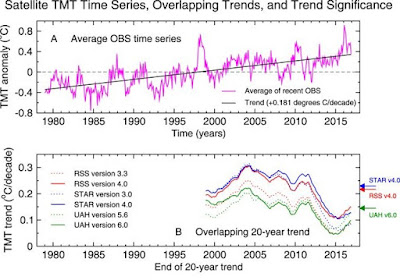
In fact, the 2015/2016 El Niño was weaker than (or about as strong as, in some regions) the 1997/1998 El Niño, even though 2015/2016 was warmer than 1997/1998, as shown in "Myth: No Global Warming for Two Decades". Figure 2 below depicts this warming using the mid- to upper tropospheric warming that Spencer commented on, while figure 3 displays the MEI and figure 4 depicts one regional component of the MEI:

Figure 2: (A, Top panel) Near global relative mid- to upper tropospheric temperature trend from 1979 - 2017, estimated as an average of the UAH, NOAA/STAR, and RSS satellite-based analyses.
(B, Bottom panel) 20-year mid- to upper tropospheric temperature trends for the satellite-based analyses. The year on the x-axis denotes the endpoint for the 20-year trend, while the y-axis represents the magnitude of the warming trend. Solid lines indicate the newest versions of each satellite-based analysis, while the dotted lines represent older versions [2].


Figure 3: Multivariate ENSO index (MEI). The red peaks represent El Niño events and the blue troughs represent La Niña events. The relative magnitudes of the peaks and troughs are proportional to the strength of corresponding El Niño and La Niña events [3; 7]. See figure 4 for a representation of some of the uncertainties involved in calculating the magnitude El Niño and La Niña events.


Figure 4: Non-cumulative ENSO index (Niño3.4) based on ocean temperature in the east central equatorial Pacific, up to the year 2016. Niño3.4 is one of several non-cumulative indexes used in generating the non-cumulative MEI shown in figure 5. Red lines indicate the Niño3.4 index values, while the black region represents uncertainty at the 95% confidence level [4].

So given this evidence, why do Spencer and his followers defend their myth? Well, they may be (intentionally or unintentionally) conflating the following two claims:
  • El Niño contributed to 2015/2016 being warmer than 2014
  • El Niño contributed to 2015/2016 being warmer than 1997/1998

The first claim is true, since El Niño conditions were stronger in 2015/2016 than 2014. However, since the 2015/2016 El Niño was weaker than the 1997/1998 El Niño (see figure 3), then the second claim is false. It is this second claim that Spencer defends when he claims that the past two decades of warming was natural. So Spencer is defending a false myth.

To put this another way, the distinction between the above two bullet points is analogous to the distinction between:
  • Earth's 24-hour rotation cycle contributed to late afternoon in summer being warmer than midnight in summer in Canada
  • Earth's 24-hour rotation cycle contributed to late afternoon in summer being warmer than noon (with the Sun at its zenith) in winter in Canada

The first claim is true, since Earth's shorter-term, 24-hour rotation cycle causes Canada to receive more solar energy at during late afternoon than during midnight. However, the second point fails, since Earth's 24-hour rotation cycle would cause a late afternoon day to be cooler than noon. Instead Earth's axial tilt relative to the Sun, not Earth's 24-hour rotation cycle, explains the longer-term, multi-month warming from the winter to summer.

Analogously, El Niño contributes to shorter-term warming on an inter-annual time scale, while other factors contribute to longer-term warming on a multi-decadal time-scale. If you're curious about what those "other factors" are, then see section 3.7 of "John Christy Fails to Show that Climate Models Exaggerate CO2-induced Warming" and "Myth: The Sun Caused Recent Global Warming and the Tropical Stratosphere Warmed".

In response to the above points, a critic might claim that the energy from El Niño accumulates over the long-term. So, for instance, the 1997/1998 El Niño expelled a large amount of energy that persisted for 10+ years, explaining why the post-1998 period was warmer than the pre-1998 period. According to a such a critic, I would need to use a cumulative MEI to account for this accumulated energy, instead of the non-cumulative MEI I used above. Figure 5 below presents John Christy's cumulative MEI, in contrast to the non-cumulative MEI I presented above in figure 3:

Figure 5: Cumulative TSI (total solar irradiance) and cumulative MEI used by Christy et al. [5, page 18].

But scientists rarely (if ever) use a cumulative MEI. In fact, I know of no peer-reviewed scientific paper that uses a cumulative MEI or cumulative total solar irradiance (TSI). Instead the cumulative MEI and TSI remain relegated to non-peer-reviewed sources (or fake, predatory "journals" not listed on a reputable citation index) which are more amenable to unfounded claims than are peer-reviewed sources. Scientists instead use a non-cumulative MEI in their peer-reviewed work. Some researchers accumulate ENSO measures intra-annually, across months within a year. This however, yields very different results from figure 5's inter-annual accumulation across multiple years. It is one thing to say that released energy from ENSO temporarily accumulates for months; it is quite another thing to say that energy accumulates and remains for years or decades. Even Spencer and Christy, two critics of mainstream climate science, use a non-cumulative MEI in their peer-reviewed research. Christy even cites peer-reviewed sources that use a non-cumulative MEI, including work from his research colleague Roy Spencer.

There are at least three reasons why scientists employ a non-cumulative MEI instead of a cumulative MEI:
  • A cumulative MEI is arbitrary, since it involves arbitrarily selecting a period over which the MEI accumulates.
  • A cumulative MEI compromises the relationship between the MEI and the temperature trends one uses the MEI to predict.
  • A cumulative MEI violates basic physics.

Christy, as a climate scientist, makes a version of the first two points for cumulative TSI in his peer-reviewed work. So Christy likely knows the cumulative indices are nonsense. Yet he previously used a cumulative MEI and a cumulative TSI in his non-peer-reviewed blog articles to argue that solar-induced changes in ENSO caused most of the post-1970s global warming; I discuss Christy's double standard on this in section 2.3 of "Myth: The Sun Caused Recent Global Warming and the Tropical Stratosphere Warmed" (Christy has a long history of misrepresenting science in politically expedient ways, as I discuss in "John Christy and Atmospheric Temperature Trends"). Timothy Osborn, another climate scientist, argues for the first and third points in response to Christy's use of a cumulative MEI.

Osborn points out that a warmer Earth would radiate more energy into space (as per the Stefan-Boltzmann law), instead of all the energy just accumulating. Scientists can observe this increased radiation during a warm El Niño; the radiation increase occurs largely because El Niño increases cloud cover and these clouds then reflect the solar radiation Earth would otherwise absorb. This cloud-based mechanism compensates for less emission of radiation by clouds during El Niño. 

So increased radiation during warm El Niño events means that energy from a two-year El Niño event does not simply accumulate for 10+ years, contrary to the cumulative MEI. Thus a cumulative MEI violates basic physics, making a non-cumulative MEI more appropriate than a cumulative MEI. And a non-cumulative MEI reveals that El Niño did not cause the post-1997 warming trend, as I explained above and as Christy himself showed.

To wrap things up: in accounting for ENSO, one needs to account not only for the 2015/2016 El Niño, but also for the 1997/1998 El Niño and the 2011 - 2014 La Niña years. A non-ENSO warming effect must have kept the 2011 - 2014 La Niña years nearly as warm, or warmer than, the 1997/1998 El Niño years, as per figures 6 and 7 below. Figures 6 and 7 (among other studies) use the non-cumulative MEI and other parameters to quantify the contribution of various factors to near-surface warming trends, including during the post-1997 period. Note that ENSO contributes to annual/short-term temperature spikes and decreases, while other factors, such as human-made greenhouse gases ("GHG", including CO2) and aerosols, drive longer-term temperature trends before and through the post-1997 period:


Figure 6: (A) Global surface temperature trend from 1891 - 2017 relative to a baseline of 1961 - 1990, as depicted in various analyses.
(B) Contributions to the trend in panel A, from (a) the Atlantic Multi-decadal Oscillation, (b) the El Niño-Southern Oscillation and the Interdecadal Pacific Oscillation, (c) volcanoes, (d) solar output in the form of total solar irradiance {TSI}, (e) greenhouse gases and anthropogenic aerosols combined, (f) the Arctic Oscillation, and (g) the residual left over when the effect of factors a through f are subtracted out from panel A.
(C) (a) Comparison of the relative surface temperature trend for 1891 - 2015 from panel A {black line} to the sum of the factors mentioned in panel B, sub-panels a through f {red line}. (b) Comparison of the relative surface temperature trend from 1891 - 2015 from panel A {black line} to climate model projections {blue line} from phase 5 of the Coupled Model Intercomparison Project {CMIP5} [6, figure 1A]. This panel exaggerates recent differences between the CMIP5 projections and the relative surface temperature trend, for reasons I discuss in sections 2.1 and 2.3 of "Myth: Santer et al. Show that Climate Models are Very Flawed".

The residual temperature spike around the 1940s in panel g likely stems from uncertainties tied to changes in temperature monitoring practices during World War II, as I discuss in "Myth: Karl et al. of the NOAA Misleadingly Altered Ocean Temperature Records to Increase Global Warming". Figure 7 below accounts for that.


Figure 6: Relative global surface temperature trend from 1850 - 2017 (observations), with the contribution of various factors to this temperature trend (colored lines). The gray line is the sum of each of the depicted colored lines. The surface temperature trend takes into account changes in sea surface temperature measuring practices during the 1930s and 1940s, which I elaborate more on in "Myth: Karl et al. of the NOAA Misleadingly Altered Ocean Temperature Records to Increase Global Warming". The authors of this figure adapted it from the results of their 2019 paper [8 - 10].

This figure displays global warming acceleration post-1998. Post-1998 acceleration also appears in global surface temperature trend analyses such as ERA5 (which is endorsed by the contrarians Judith Curry and Ryan Maue), NASA's GISTEMP, NOAA's global analysis, NCEP-2, and 20CR, consistent with other sources on accelerating climate change. For further discussion of accelerating warming, see section 2.1 of "Myth: The IPCC's 2007 ~0.2°C/decade Model-based Projection Failed and Judith Curry's Forecast was More Reliable". 

Increases in human-made greenhouse gases also caused warming in the bulk troposphere, while ENSO contributed to annual/short-term temperature spikes and decreases. For the deeper oceans, where ~90% excess energy goes, warming continued post-1997 as well. This longer-term deeper ocean warming is explained by factors other than El Niño (especially by increases in human-made GHGs), since El Niño transfers energy from the deeper oceans to the surface, leading to a very short-term drop in ocean heat content.


3. Posts Providing Further Information and Analysis


4. References


  1. "Global temperature evolution 1979–2010"
  2. "Tropospheric warming over the past two decades"
  3. https://www.esrl.noaa.gov/psd/enso/mei/ (http://archive.is/FDaO5; accessed April 13, 2019)
  4. "Ranking the strongest ENSO events while incorporating SST uncertainty"
  5. "On the Existence of a “Tropical Hot Spot" & The Validity of EPA’s CO2 Endangerment Finding"
  6. "Causes of irregularities in trends of global mean surface temperature since the late 19th century"
  7. https://climexp.knmi.nl/getindices.cgi?WMO=NOAAData/mei&STATION=MEI&TYPE=i&id=someone@somewhere
  8. https://www.carbonbrief.org/guest-post-why-natural-cycles-only-play-small-role-in-rate-of-global-warming [http://archive.is/SaRPi]
  9. "A limited role for unforced internal variability in twentieth-century warming"
  10. http://www.realclimate.org/index.php/archives/2019/06/unforced-variations-vs-forced-responses [http://archive.is/NGGih]

+Myth: No Global Warming for Two Decades

The outline for this post is as follows:
  1. The Myth and Its Flaw
  2. Context and Analysis
  3. Posts Providing Further Information and Analysis
  4. References

This is the "+References" version of this post, which means that this post contains my full list of references and citations. If you would like an abbreviated and easier to read version, then please go to the "main version" of this post.

References are cited as follows: "[#]", with "#" corresponding to the reference number given in the References section at the end of this post.


1.  The Myth and Its Flaw


The myth states that there has been, or would be, no warming over or within the past two decades.

Purveyors of this myth include Christopher Monckton [1, pages 122 and 127; 2, pages 1379, 1385, and 1387], Willie Soon [1, pages 122 and 127; 2, pages 1379, 1385, and 1387], David Legates [1, pages 122 and 127; 2, pages 1379, 1385, and 1387], John Christy [3; 4], Ted Cruz [5, page 1], Scott Pruitt [25; 100, page 145], James Delingpole [112; 113], Peter Ferrara [127], Clive Best [196; 341], Dennis Avery [132], David Archibald [94; 95, figure 30 on page 21], Anthony Watts [6; 44], Patrick Michaels [7, page 5 and chapter 13; 155], Paul (Chip) Knappenberger [7, page 5 and chapter 13], Fritz Vahrenholt [147], Sebastian Lüning [133; 147], Judith Curry [40; 44; 120; 149, citing 150; 221; 222; 234; 235] (Curry also predicts no near-future warming for decades [106 - 109; 120; 221; 222; 234]), DocMartyn on Judith Curry's blog [148], David J. Pristash of the Principia Scientific International blog [188], Bob Tisdale [44], William Gray [202, figure 14 on page 13; 203; 204], Don Easterbrook [94; 96; 97; 101, pages 1 and 2; 197, figure 24 on page 456; 239], Habibullo Abdussamatov [121, figure 3; 122; 233], Nils-Axel Mörner [139, section 2.2], François Gervais [194], Joachim Seifert [183, pages 2, figure 2, and figure A4], Frank Lemke [183, pages 2, figure 2, and figure A4], Girma Orssengo [128, figure 3], Carl-Otto Weiss [123, from 14:37 to 18:52; 124, figure 3], Dietrich Koelle [125], Herbert Grubel [87], Pat Frank [218; 219], Ira Glickstein [104; 105], Leonid B. Klyashtorin [159, figure 5; 220], Alexey A. Lyubushin [159, figure 5; 220], Yanjun Mao [192, figure 2; 193], Jiqing Tan [192, figure 2; 193], Bomin Chen [192, figure 2; 193], Huiyi Fan [192, figure 2; 193], Cliff Ollier [131], Scott Armstrong [114 - 119], Richard Lindzen [41, page 421; 86, page 7; 136], Sherwood Idso [276, citing 277; 278, citing 279], Ole Humlum [189, section 4] (who runs the contrarian blog Climate4You [190]), Jan-Erik Solheim [189, section 4], Kjell Stordahl [189, section 4], Nicola Scafetta [90, figure 12; 91, figure 16; 92, figure 6; 111, figure 5; 154, page 74 and figure 5 on page 82; 268], Craig Loehle [154, page 74 and figure 5 on page 82; 158, figure 6; 268], Syun-Ichi Akasofu [89, figure 5; 273] (some of Akasofu's own defenders admit he under-estimated warming [256, citing 257 - 259, for 260; similar point in: 261 - 263; 287]), Norman J. Page [201, figure 12 on page 14; 211], Qing-Bin Lu [140, figure 12 on page 7; 141; addressed in: 142 - 146], Matt Ridley [48], Ian Plimer [94; 102; 103], Thayer Watkins [205 - 207], Alan Rudge [102; 103], Anastasios Tsonis [42, page 4; 43; 129; 130; 162, paragraphs 14 and 15; 241; 242, 342], Joseph D'Aleo [197, figure 24 on page 456; 198 - 200], Dan Pangburn [269; 270; 271 (with 283 - 286)], Warren Meyer [274], and Joe Bastardi [98; 99] (Bastardi claims a decade of cooling for 2011 - 2021 [98; 99], and thus his claim is not yet falsified, though post-2011 trends so far suggest his claim will likely fail, as shown in section 2). I discuss some of these myth proponents' debunked temperature trend predictions in a separate multi-tweet Twitter thread [93], with a separate thread that also rebuts Curry's claims [134].

(All of these myth proponents also run afoul of the quantified post-1997 and post-1998 surface warming trends in section 2.1 of "Myth: The IPCC's 2007 ~0.2°C/decade Model-based Projection Failed and Judith Curry's Forecast was More Reliable").

Myth: No Global Warming for Two Decades

The outline for this post is as follows:
  1. The Myth and Its Flaw
  2. Context and Analysis
  3. Posts Providing Further Information and Analysis
  4. References

This is the "main version" of this post, which means that this post lacks most of my references and citations. If you would like a more comprehensive version with all the references and citations, then please go to the "+References" version of this post.

References are cited as follows: "[#]", with "#" corresponding to the reference number given in the References section at the end of this post.


1.  The Myth and Its Flaw


The myth states that there has been, or would be, no warming over or within the past two decades.

Purveyors of this myth include Christopher Monckton, Willie Soon, David LegatesJohn Christy, Ted Cruz, Scott Pruitt, James Delingpole, Peter Ferrara, Clive Best, Dennis Avery, David Archibald, Anthony Watts, Patrick Michaels, Paul (Chip) Knappenberger, Fritz Vahrenholt, Sebastian Lüning, Judith Curry (Curry also predicts no near-future warming for decades), DocMartyn on Judith Curry's blog, David J. Pristash of the Principia Scientific International blog, Bob Tisdale, William Gray, Don Easterbrook, Habibullo Abdussamatov, Nils-Axel Mörner, François Gervais, Joachim Seifert, Frank Lemke, Girma Orssengo, Carl-Otto Weiss, Dietrich Koelle, Herbert Grubel, Pat Frank, Ira Glickstein, Leonid B. Klyashtorin, Alexey A. Lyubushin, Yanjun Mao, Jiqing Tan, Bomin Chen, Huiyi Fan, Cliff Ollier, Scott Armstrong, Richard Lindzen, Sherwood Idso, Ole Humlum (who runs the contrarian blog Climate4You), Jan-Erik Solheim, Kjell Stordahl, Nicola Scafetta, Craig Loehle, Syun-Ichi Akasofu (some of Akasofu's own defenders admit he under-estimated warming), Norman J. Page, Qing-Bin Lu, Matt Ridley, Ian Plimer, Thayer Watkins, Alan Rudge, Anastasios Tsonis, Joseph D'Aleo, Dan Pangburn, Warren Meyer, and Joe Bastardi (Bastardi claims a decade of cooling for 2011 - 2021, and thus his claim is not yet falsified, though post-2011 trends so far suggest his claim will likely fail, as shown in section 2). I discuss some of these myth proponents' debunked temperature trend predictions in a separate multi-tweet Twitter thread [11], with a separate thread that also rebuts Curry's claims [12].

(All of these myth proponents also run afoul of the quantified post-1997 and post-1998 surface warming trends in section 2.1 of "Myth: The IPCC's 2007 ~0.2°C/decade Model-based Projection Failed and Judith Curry's Forecast was More Reliable").

Beginning of a new series for scientific debunking

After some reflection, I realize that the posts in the "Science (detailed discussion)" section may be too long and off-putting for some readers, even given the shorter summaries I included in each post. To address this issue, I'm going to start a "Quick Scientific Debunking" series with its own page. This series will include shorter posts that address specific myths about science. I will still keep the "Science (detailed discussion)" page; this page will deal with topics in more depth and will debunk sources that contain numerous errors.

I hope people enjoy the new series.