The outline for this post is as follows:
- The Myth and Its Flaw
- Context and Analysis (divided into multiple sections)
- Posts Providing Further Information and Analysis
- References
This is the "+References" version of this post, which means that this post contains my full list of references and citations. If you would like an abbreviated and easier to read version, then please go to the "main version" of this post.
References are cited as follows: "[#]", with "#" corresponding to the reference number given in the References section at the end of this post.
The following twitter threads summarize some of the main points in this blogpost:
https://twitter.com/AtomsksSanakan/status/1013105778763468800
https://twitter.com/AtomsksSanakan/status/932649966383849474
1. The Myth and Its Flaw
Climate models predict that in moist tropical areas, a region of the lower atmosphere will warm more than Earth's surface [10; 25, pages 4 and 22; 26, from 31:01 to 31:48; 27 - 30; 50; 52; 192; 216, pages 7 and 8; 217, pages 101 and 102; 236; 237; 241]. This region of greater warming is known as the "hot spot" [8; 16, pages 14 and 42; 31, page 6; 32]. The myth claims that there is little-to-no evidence of a hot spot, or the scientific evidence argues against the hot spot's existence.
Proponents of this myth include David Evans [1 - 7; 109; 148; 149; 171; 172; 189; 193; 203; 386], Stefan Molyneux [7], Judith Curry [8], Richard Lindzen [9, page 942; 409, page 7], S. Fred Singer [10; 211; 212; 287, pages 3, 27 - 32, and 34 - 39], Nicola Scafetta [275, appendix Y on page 53; 287, pages 3, 27 - 32, and 34 - 39], Christopher Monckton [10; 11; 463], Anthony Watts [12; 54], John Christy [8; 13 - 17; 209; 257; 397], Roger Pielke Sr. [8; 15; 209], Jospeh D'Aleo [16; 17; 287, pages 3, 27 - 32, and 34 - 39], James Wallace III [16; 17; 287, pages 3, 27 - 32, and 34 - 39], Steve McIntyre [18], Ross McKitrick [108; 321], Matt Ridley [164], Ryan Maue [294], Luboš Motl [435; 436], The Daily Caller [19], Peter Taylor [429, pages 43 and 71], Paul Homewood [20], Tom Nelson [21], David Stockwell [430, pages 2 and 10], Roy Spencer [32; 117; 158; 257; 287, pages 3, 27 - 32, and 34 - 39; 397], Craig Idso [287, pages 3, 27 - 32, and 34 - 39], Timothy Vogelsang [322], William Happer [287, pages 3, 27 - 32, and 34 - 39], Tim Ball [287, pages 3, 27 - 32, and 34 - 39], Tony Heller (a.k.a. Steven Goddard) [288], Don Easterbrook [287, pages 3, 27 - 32, and 34 - 39], EIKE (the European Institute for Climate and Energy) [293], Anthony Lupo [287, pages 3, 27 - 32, and 34 - 39], Vladan Ducic [144; 145], A. S. Lavrov [146], Steve Milloy [404], Rud Istvan [298], and a number of blogs including WattsUpWithThat [22 - 24], Climate Etc. [147], Global Warming Policy Foundation [161], the Heartland Institute [162], Popular Social Science [163], GlobalWarming.org [159], No Tricks Zone [290], CO2 is Life [291], US Issues [292], Turbulent Eddie [297; 485], Friends of Science [160] (via Clive Best [289]), and various folks online [303].
Christy [16; 17], D'Aleo, Wallace III [16; 17; 287, pages 3, 27 - 32, and 34 - 39], and an organization known as ICECAP [200; 287, pages 3, 27 - 32, and 34 - 39], use the myth to attack the US Environmental Protection Agency's attempts to regulate CO2 emissions. Interestingly, a Friends of Science representative objects to the method Christy, D'Aleo, and Wallace III use to claim that there was no hot spot [210, comment from Ken Gregory in the comments section]. So myth advocates do not necessarily agree with one another.
Based on the myth proponents listed above, this myth's bandwagon includes some of the most prominent "skeptics" of the scientific consensus on man-made climate change. This group of "skeptics" includes Curry and Christy, two of the four witnesses who testified in a climate science Congressional hearing held earlier this year [110; 111]. And of all the myth defenders, David Evans may be the most strident and persistent in his defense of the myth. For example, Evans says:
Climate models predict that in moist tropical areas, a region of the lower atmosphere will warm more than Earth's surface [10; 25, pages 4 and 22; 26, from 31:01 to 31:48; 27 - 30; 50; 52; 192; 216, pages 7 and 8; 217, pages 101 and 102; 236; 237; 241]. This region of greater warming is known as the "hot spot" [8; 16, pages 14 and 42; 31, page 6; 32]. The myth claims that there is little-to-no evidence of a hot spot, or the scientific evidence argues against the hot spot's existence.
Proponents of this myth include David Evans [1 - 7; 109; 148; 149; 171; 172; 189; 193; 203; 386], Stefan Molyneux [7], Judith Curry [8], Richard Lindzen [9, page 942; 409, page 7], S. Fred Singer [10; 211; 212; 287, pages 3, 27 - 32, and 34 - 39], Nicola Scafetta [275, appendix Y on page 53; 287, pages 3, 27 - 32, and 34 - 39], Christopher Monckton [10; 11; 463], Anthony Watts [12; 54], John Christy [8; 13 - 17; 209; 257; 397], Roger Pielke Sr. [8; 15; 209], Jospeh D'Aleo [16; 17; 287, pages 3, 27 - 32, and 34 - 39], James Wallace III [16; 17; 287, pages 3, 27 - 32, and 34 - 39], Steve McIntyre [18], Ross McKitrick [108; 321], Matt Ridley [164], Ryan Maue [294], Luboš Motl [435; 436], The Daily Caller [19], Peter Taylor [429, pages 43 and 71], Paul Homewood [20], Tom Nelson [21], David Stockwell [430, pages 2 and 10], Roy Spencer [32; 117; 158; 257; 287, pages 3, 27 - 32, and 34 - 39; 397], Craig Idso [287, pages 3, 27 - 32, and 34 - 39], Timothy Vogelsang [322], William Happer [287, pages 3, 27 - 32, and 34 - 39], Tim Ball [287, pages 3, 27 - 32, and 34 - 39], Tony Heller (a.k.a. Steven Goddard) [288], Don Easterbrook [287, pages 3, 27 - 32, and 34 - 39], EIKE (the European Institute for Climate and Energy) [293], Anthony Lupo [287, pages 3, 27 - 32, and 34 - 39], Vladan Ducic [144; 145], A. S. Lavrov [146], Steve Milloy [404], Rud Istvan [298], and a number of blogs including WattsUpWithThat [22 - 24], Climate Etc. [147], Global Warming Policy Foundation [161], the Heartland Institute [162], Popular Social Science [163], GlobalWarming.org [159], No Tricks Zone [290], CO2 is Life [291], US Issues [292], Turbulent Eddie [297; 485], Friends of Science [160] (via Clive Best [289]), and various folks online [303].
"Memo to believers of global catastrophe: Here’s a strategic tip — run, flee, hide, and avoid the Hot Spot argument at all costs. (You can’t win) [149]."
Though I do not buy into the "global catastrophe" straw man [150, section 3.2.3 on page 41, pages 48 - 50] Evans offers, I also do not want to "run, flee, [and] hide" when told to. So let's examine the hot spot argument / myth.
The myth's flaw: tropical precipitation/convection patterns [45 (as cited in 242, page 651; 348, section 4; 350); 92; 97 (as cited in 242, page 651; 349, sections 1, 5, and 6); 441; 442; 467; 510] and land-based records [46; 118; 125; 126; 127, figure 2b; 128, figure 3 on page 4567; 130, as per 131; 447 - 449; 457] provide evidence of the hot spot, as do the vast majority of satellite analyses [27; 33; 34; 37; 43; 214; 506], radiosonde (weather balloon) analyses [55 - 59; 63; 64; 506], and re-analyses [77; 89 - 92; 239]. So the preponderance of the evidence shows that hot spot exists, contrary to the myth. Scientists have had evidence of the hot spot since at least 2004 [33]. Yet myth proponents typically obscure this point by cherry-picking to avoid evidence of the hot spot, or by not acknowledging that their sources show the hot spot.
I discuss the lines of evidence in the following sections:
- sections 2.2 and 2.3 : satellites
- section 2.3 : land-based
- section 2.4 : radiosondes
- section 2.5 : re-analyses
- section 2.6 : tropical precipitation and convection
2. Context and Analysis
Section 2.1: What the "hot spot" is, and what myth proponents claim about it
Earth's atmosphere contains multiple layers. The layer closest to the Earth's surface air is known as the troposphere. Tropospheric temperature decreases with increasing height; the rate of decrease is known as the tropospheric lapse rate.
Climate models and basic physical theory predict that warming at Earth's surface will cause more water to evaporate, especially over tropical oceans. This evaporation increases the amount of water vapor in the air, since warmer air can hold more water vapor. The vapor-rich air then rises into the troposphere by convection. The water vapor subsequently condenses with increasing tropospheric height, since tropospheric temperature and pressure decrease with increasing height.
Condensation of water vapor releases some of the energy that went into evaporating the water; this is known as release of latent heat. This latent heat release causes tropospheric warming. So latent heat release causes more warming of the lower troposphere and even more warming of the upper troposphere, as water vapor condenses with increasing height. Thus latent heat release shrinks the rate at which tropospheric temperature decreases with increasing height; in this way latent heat release reduces the magnitude of the tropospheric lapse rate [10; 25, pages 4 and 22; 26, from 31:01 to 31:48; 27 - 30; 50; 52; 192; 216, pages 7 and 8; 217, pages 101 and 102; 236; 237; 241; 405, page 2048; 440; 458], as depicted in figure 1:

Figure 1: A diagram of tropical tropospheric warming reducing the magnitude of the tropospheric lapse rate (adapted from Crok, Strengers, and Verheggen [31, page 3], though originally taken from a climate science textbook [466]). The horizontal dimension represents temperature, with temperature increasing as one goes from left to right. The vertical dimension represents altitude in the troposphere, with altitude increasing as one goes further up from Earth's surface at the black line. The blue line represents the tropical temperature profile before warming, while the red line represents the tropical temperature profile after warming. Latent heat release causes more warming with increasing height [10; 25, pages 4 and 22; 26, from 31:01 to 31:48; 27 - 30; 50; 52; 192; 236; 237; 405, page 2048; 458], leading to the red line being steeper than the blue line. As a result, there is less of a temperature decrease with increasing height after tropical warming. Thus the lapse rate's magnitude is greater for the blue line than for the red line, indicative of a lapse rate reduction in response to tropical warming.
Section 2.1: What the "hot spot" is, and what myth proponents claim about it
Earth's atmosphere contains multiple layers. The layer closest to the Earth's surface air is known as the troposphere. Tropospheric temperature decreases with increasing height; the rate of decrease is known as the tropospheric lapse rate.
Climate models and basic physical theory predict that warming at Earth's surface will cause more water to evaporate, especially over tropical oceans. This evaporation increases the amount of water vapor in the air, since warmer air can hold more water vapor. The vapor-rich air then rises into the troposphere by convection. The water vapor subsequently condenses with increasing tropospheric height, since tropospheric temperature and pressure decrease with increasing height.
Condensation of water vapor releases some of the energy that went into evaporating the water; this is known as release of latent heat. This latent heat release causes tropospheric warming. So latent heat release causes more warming of the lower troposphere and even more warming of the upper troposphere, as water vapor condenses with increasing height. Thus latent heat release shrinks the rate at which tropospheric temperature decreases with increasing height; in this way latent heat release reduces the magnitude of the tropospheric lapse rate [10; 25, pages 4 and 22; 26, from 31:01 to 31:48; 27 - 30; 50; 52; 192; 216, pages 7 and 8; 217, pages 101 and 102; 236; 237; 241; 405, page 2048; 440; 458], as depicted in figure 1:
 |
Figure 1: A diagram of tropical tropospheric warming reducing the magnitude of the tropospheric lapse rate (adapted from Crok, Strengers, and Verheggen [31, page 3], though originally taken from a climate science textbook [466]). The horizontal dimension represents temperature, with temperature increasing as one goes from left to right. The vertical dimension represents altitude in the troposphere, with altitude increasing as one goes further up from Earth's surface at the black line. The blue line represents the tropical temperature profile before warming, while the red line represents the tropical temperature profile after warming. Latent heat release causes more warming with increasing height [10; 25, pages 4 and 22; 26, from 31:01 to 31:48; 27 - 30; 50; 52; 192; 236; 237; 405, page 2048; 458], leading to the red line being steeper than the blue line. As a result, there is less of a temperature decrease with increasing height after tropical warming. Thus the lapse rate's magnitude is greater for the blue line than for the red line, indicative of a lapse rate reduction in response to tropical warming. |
So the tropical troposphere should behave somewhat like a moist adiabat, in which the rate of warming increases with increasing height in response to water vapor condensing from vapor-saturated air [10; 25, pages 4 and 22; 26, from 31:01 to 31:48; 27 - 30; 50; 52; 192; 216, pages 7 and 8; 217, pages 101 and 102; 236; 237; 241; 405, page 2048; 440, figure 1c; 458].
"One of the most vivid predictions of global warming theory is a “hotspot” in the tropical upper troposphere, where increased tropical convection responding to warming sea surface temperatures (SSTs) is supposed to cause enhanced warming in the upper troposphere.
The trouble is that radiosonde (weather ballons [sic]) and satellites have failed to show evidence of a hotspot forming in recent decades. Instead, upper tropospheric warming approximately the same as surface warming has been observed [32]."
So the hot spot I will discuss relates to amplification of warming as one goes from the tropical surface to higher in the tropical troposphere [8; 15; 16, pages 14 and 42; 27, page 383; 31, page 6; 32; 172; 299; 321; 322; 397 - 399; 403; 463; 464, page 89]. This is different from the question of whether the amount or magnitude of observed tropospheric warming matches the amount of warming projected by climate models [31, pages 5 - 7; 108; 321]; I address the "magnitude" issue in "Myth: Santer et al. Show That Climate Models are Very Flawed", and to a lesser extent in "Myth: The CCSP Presented Evidence Against the Hot Spot's Existence". So, for the sake of argument, I will take the advice of the myth proponent John Christy [8; 13 - 17; 209; 257; 397] and not compare observations to models:
"Section III. Research Design
Unlike some research in this area, this research does not attempt to evaluate the existence of the THS [tropical hot spot] in the real world by using the climate models. This would constitute a well-known error in mathematics and econometrics [...] [16, page 14]."
But in case you are interested in what the models show, figure 2 depicts a modeled hot spot (amplification of warming with increasing height in the tropics) in response to warming caused by increased solar activity or in response to warming caused by increased carbon dioxide (CO2):
 |
Figure 2: ECHAM3/LSG model (European Center/Hamburg Model 3 / Large Scale Geostrophic coupled atmosphere-ocean climate model) simulation of the atmospheric response to (a) increased solar forcing (from increased solar output) and (b) increased CO2 forcing (from increased CO2 levels). Colored areas indicate significant responses, with darker blues indicating cooling and darker reds indicating warming. The horizontal axis represents latitude, with the tropics being between roughly 30°N and 30°S. The vertical axis represents altitude, with decreasing atmospheric pressure as altitude increases [112, page 707]. The tropical troposphere lies below 150hPa, while the tropical stratosphere is above 70hPa [65]. Tropical tropospheric warming increases with height in both panels a and b, indicating that the hot spot forms in response to both solar-induced warming and CO2-induced warming. In contrast, strong tropical stratospheric cooling comes with CO2-induced warming, but not solar-induced warming. This figure is taken from a 2001 report of the United Nations Intergovernmental Panel on Climate Change (IPCC) [112, page 707]. Models differ with respect to the extent of the tropospheric amplification [112, page 707; 191, figure 1.3 on page 25 and figure 5.7 on page 116; 239, figure 1; 241, figure 12b; 276, figure 1; 337, figure 4; 338; 340 as taken from 339; 341, figure 1; 342, figures 10 and 13; 343, plates 2 and 3; 344, figure 20 on page 28; 345, figure 9.1 on page 675; 346, figure 1, and supplemental figures S1, S2, and S3], with amplification limited to roughly 25°N to 25°S in some models [276, figure 1; 337, figure 4; 346, figure 1, and supplemental figure S2], while other models extend the amplification to almost 55°N to 55°S [112, page 707; 340 as taken from 339]. |
Myth proponents claim that scientific evidence argues against the hot spot's existence, or that there is little-to-no evidence of the hot spot's existence [1 - 24; 32]. Many myth proponents then falsely claim that the absence of the hot spot is evidence against CO2-induced global warming, as I discussed in "Myth: The Tropospheric Hot Spot is a Fingerprint of CO2-induced Warming".
Section 2.2: Overview of evidence showing the hot spot exists
But the myth proponents' argument fails, since multiple sources of evidence show the hot spot exists. Such consilient/convergent, reproducible lines of evidence for the hot spot increase the likelihood that it exists [49; 177; 191, pages 14, 42, 120, and 122; 451, from 6:10 to 7:36; 474; 475; 503]. Let's go through some of these lines of evidence, which are as follows:
- Land-based trends from both the recent past [125; 126; 127, figure 2b; 128, figure 3 on page 4567; 130, as per 131; 447 - 449; 457; 465] and the distant past [46; 118] (the latter represents paleoclimate evidence [46; 118])
- Satellite-based temperature records based on microwave emissions (microwave sounding units, or MSUs) [27; 33; 34; 37; 43; 214; 506]
- Measurements from weather balloons (radiosondes) [55 - 59; 63; 64; 504, figure 15; 506; 511, figure 10]
- Temperature re-analyses [77; 89 - 92; 504, figure 15]
- Tropical precipitation and convection patterns [45 (as cited in 242, page 651; 348, section 4; 350); 92; 97 (as cited in 242, page 651; 349, sections 1, 5, and 6); 441; 442; 467; 510]
- Satellite-based temperature records based on global positioning system radio occultation (GPS RO) [508 (with: 137, figures 1 and 3; 139, figure 4; 156, figure 4; 300, figure 1; 305, figure 4 and section 4; 454 (with a upper tropospheric tropical warming trend greater than the near-surface tropical warming trend in 306 - 312 {generated using 201 and 202}); 506; 509)]
(In this post I will focus on multi-decadal time-scales for the hot spot. I discuss evidence of hot spots on shorter time-scales in "Myth: The Tropospheric Hot Spot is a Fingerprint of CO2-induced Warming".)
The 2nd, 3rd, and 4th sources above have been cited by many myth proponents [1 - 9; 11; 12; 15 - 24; 54; 76, pages 4 - 7; 431, page 104], so I do not see how they could object to me citing those sources as well. For instance, the myth proponent John Christy [8; 13 - 17; 209; 257; 397] states the following in another context, when emphasizing how satellite-based analyses, radiosonde-based analyses, and re-analyses all (supposedly) support a claim he made:
"The satellites, balloons and reanalyses, 12—10 different measuring systems, show the same thing [431, page 104]."
(In sections 2.2, 2.3, and 2.4 of "Myth: Santer et al. Show that Climate Models are Very Flawed", I explain why the analyses in question do not actually show what Christy claims they show)
GPS RO [136; 137; 139 - 142; 156; 454; 506;; 508; 509] offers a 6th means of detecting the hot spot. Though GPS RO and MSUs both use satellites, they are still independent methods; this allows scientists to use GPS RO to validate MSU results, or vice versa [305; 331, section 2.3; 332 - 335; 352; 506, with 507]. The GPS RO record was once too short [138; 143; 300; 305; 454; 506] to be useful in detecting a multi-decadal hot spot, though GPS RO data revealed a hot spot in response to shorter-term warming [137, figures 1 and 3; 139, figure 4; 156, figure 4; 300, figure 1; 305, figure 4 and section 4; 454 (with a upper tropospheric tropical warming trend greater than the near-surface tropical warming trend in 306 - 312 {generated using 201 and 202}); 506; 509]. As the length of the GPS RO record increased with time, scientists were able to use GPS RO to detect a longer-term hot spot [508].
And despite its initial temporal limitations, GPS RO shows cooling of the upper atmosphere [136; 137; 139; 305; 454, 506], which is a sign of the CO2-induced warming discussed in "Myth: The Sun Caused Recent Global Warming and the Tropical Stratosphere Warmed". This cooling appears in part b of figure 2 above and in figures 5, 6, 8, and 9 below. Figure 3 below also depicts this cooling in a GPS RO analysis, along with tropical upper tropospheric warming:
 |
Figure 3: GPS-RO-based warming and cooling trends in the stratosphere and troposphere from September 2001 to December 2016. The contour numbers represent the temperature trend (in K per decade) at a vertical resolution of 1 kilometer, with each contour shift representing a change of 0.1 K per decade. Red and blue shading represent statistically significant warming and cooling trends, respectively, while gray shading indicates trends that were not significant at the 2-sigma level. This gray shading reflects, in part, how the relatively small 16-year sample size of the GPS RO record limits the statistical significance of trends in particular regions. The horizontal axis represents latitude [305, figure 4], with the tropics being between roughly 30°N (30 deg.) and 30°S (-30 deg.) [112, page 707]. The vertical axis represents altitude, with the curved solid black line representing the tropopause, the border region between the troposphere and the stratosphere. The troposphere lies a bit beneath the black line and the stratosphere lies a bit above the black line [305, figure 4]. An altitude of 10km in the tropics corresponds to an atmospheric pressure of around 260hPa [143, slide 29; 191, figure 5.7 on page 116; 300, figure 1]. GPS RO results are much less reliable beneath a tropical altitude of 8km [143, slide 4; 313, page 1975; 314, pages 309 and 311; 315; 316, page 4; 317, page 2027; 318, page 1262], equivalent to an atmospheric pressure of greater than around 360hPa [143, slide 29; 191, figure 5.7 on page 116; 300, figure 1]. The tropical upper tropospheric warming depicted in red [305, figure 4] is amplified relative to tropical near-surface warming in other analyses [306 - 312, generated using 201 and 202], indicating a medium-term hot spot. |
Section 2.3: Land-based and satellite evidence from microwave emissions
Paleoclimate, land-based research indicates that the tropical lapse rate's magnitude decreased during warming in the distant past, while the lapse rate's magnitude increased in response to cooling [46; 118, figure 3]. So paleoclimate data provides one line of evidence showing a hot spot during tropical warming. Land-based records also suggest that warming increased with increasing height in the recent past [124 - 129; 130 as discussed in 131; 267; 296; 447 - 449; 457; 465] across the tropics [125; 126; 127, figure 2b; 128, figure 3 on page 4567; 130, as per 131; 447 - 449; 457; 465], though these results are more tentative [124; 128; 129; 132; 133; 465], including in the tropics [124].
Satellite-based measurements provide another independent line of evidence for the hot spot, since scientists can infer tropospheric temperature from satellite data. At least seven research groups generate satellite-based tropospheric temperature records, using different data analysis methods and different corrections for known artifacts/errors in the data. These corrections are known as homogenization and the artifacts are known as heterogeneities [27; 33 - 44; 152; 273; 352] (I discuss homogenization in more detail in section 3.1 of "John Christy, Climate Models, and Long-term Tropospheric Warming", with examples of scientists validating homogenization techniques [27; 37; 41]).
The following seven groups generated homogenized, satellite-based tropospheric temperature records:
The following seven groups generated homogenized, satellite-based tropospheric temperature records:
- a group at the University of Washington (UW) [27; 33; 34; 37 - 39; 501, with 502]
- a group at the National Oceanic and Atmospheric Administration Center for Satellite Applications and Research (NOAA/STAR or NOAA) [27; 35; 36; 214]
- a group at Remote Sensing Systems (RSS) [27; 40; 41; 214; 259; 304]
- Vinnikov et al. at the University of Maryland (UMD) [43; 96; 246]
- a group at the University of Alabama in Huntsville (UAH) [32; 42; 304]
- Weng and Zou at the University of Maryland (WZ) [44; 107; 273; 274; 387; 484]
- Prabhakara et al. at NASA and elsewhere (P-NASA) [47, figure 10 on page 80; 392 - 394]
This may come as a surprise to the myth proponent Paul Homewood, who seems (or pretends) to live under the illusion that the UW analysis should be rejected since it is homogenized, while the UAH and RSS analyses are acceptable [20]. Homewood's logic fails, given UAH's long (and continuing) history of deeply flawed homogenization [26, from 36:31 to 37:10; 47; 49; 53, pages 5 and 6; 123; 152; 213; 215; 260; 392 - 394]. And since RSS [27; 40; 41; 214] and UAH [32; 42] analyses are also homogenized, Homewood's reasoning makes as little sense as accepting cats and rejecting dogs, because dogs are mammals. However, not all myth proponents resort to Homewood's nonsense, though David Evans also [434] falsely [41, figures 9 and 12; 42, figure 7; 152] claims that the UAH analysis does not adjust past data.
The myth proponent John Christy cites the first five satellite-based analyses listed above [76, pages 4 - 7; 98, page 1694; 116; 276; 351, page S18], while myth proponent Roy Spencer critiques [256] WZ's published research [107]. So it would be worthwhile to see if these analyses support the "no hot spot" myth. Christy has not cited WZ, to my knowledge, though WZ shows the hot spot [44, figures 12 and 13]. However, other climate scientists do not often cite WZ [47, figure 8 on page 77; 351, page S18; 450], I know of only two observational analyses (both weather balloon analyses [59; 433, figure 6]) with warming rates even half as large as that of WZ [44, figure 13], and I have some serious doubts about the veracity of WZ. So let's aside their analysis. P-NASA can also be set aside since it does not target tropical tropospheric trends [392 - 394]. That leaves us with five satellite-based tropospheric temperature records cited by the myth defender John Christy [76, pages 4 - 7; 98, page 1694; 116; 276; 351, page S18].
The myth proponent John Christy cites the first five satellite-based analyses listed above [76, pages 4 - 7; 98, page 1694; 116; 276; 351, page S18], while myth proponent Roy Spencer critiques [256] WZ's published research [107]. So it would be worthwhile to see if these analyses support the "no hot spot" myth. Christy has not cited WZ, to my knowledge, though WZ shows the hot spot [44, figures 12 and 13]. However, other climate scientists do not often cite WZ [47, figure 8 on page 77; 351, page S18; 450], I know of only two observational analyses (both weather balloon analyses [59; 433, figure 6]) with warming rates even half as large as that of WZ [44, figure 13], and I have some serious doubts about the veracity of WZ. So let's aside their analysis. P-NASA can also be set aside since it does not target tropical tropospheric trends [392 - 394]. That leaves us with five satellite-based tropospheric temperature records cited by the myth defender John Christy [76, pages 4 - 7; 98, page 1694; 116; 276; 351, page S18].
4 out of 5 satellite analyses show the hot spot, with greater warming in the tropical mid- to upper troposphere than at Earth's surface. Specifically: the UW, NOAA/STAR, RSS, and UMD analyses show the hot spot [37, table 4 on page 2285; 43, figures 8 and 10; 214]. Figure 4 shows four of these five analyses, with two versions of the UW analysis:
 |
Figure 4: HadCRUT4 tropical surface warming trends and tropical mid- to upper tropospheric warming trends (in K per decade) from 20°N to 20°S above the land, oceans, and both land and oceans from 1979 - 2012. Tropospheric warming trends are from UW, NOAA, RSS, and UAH satellite data analyses. UW(GCM) and UW use different methods for processing the satellite data. The value in parentheses is the ratio of the tropospheric warming to the surface warming for a given tropospheric temperature trend [37, table 4]. The RSS tropospheric warming trend is spuriously low due to an error in homogenization. The RSS team later corrected this error [40]. This resulted in a RSS tropical mid- to upper tropospheric warming trend that is between the NOAA trend and the UW trend [27, figure 4B on page 379]. |
Figure 4 shows amplification above the tropical oceans and the sum of land+oceans, but not above tropical land. This result is not surprising [66 (with 488 - 490); 67, page 7]. To see why, first note that as warm surface air rises to the troposphere, the warm air mixes by convection. This transfers heat from some of the warmer air that rose from the land to some of the nearby, less warm air that rose from the oceans. Thus convection and other factors make the tropospheric warming rates above the tropical land more similar to the warming rate above the nearby tropical oceans [67, page 1; 75, page 4; 443, section 1] (figure 10 in section 2.5 shows this more clearly, with tropospheric warming become more similar above different regions as one gets higher in the troposphere [89, figure 7]). And since land surface warming should be greater than ocean surface warming [26, from 31:47 to 33:33; 67 - 74; 295, figures 1c and 2c], the similar tropospheric warming rates above tropical land and oceans would imply a lower amplification ratio above land than above oceans.
One would also expect a greater amplification ratio above oceans than above land, since oceans provide a readier source of water that can evaporate, condense in the upper troposphere, and thus produce the tropospheric hot spot [66 (with 488 - 490); 67, page 7]. Thus one can explain why figure 4 shows greater tropospheric warming amplification above the tropical oceans vs. above the tropical land.
One would also expect a greater amplification ratio above oceans than above land, since oceans provide a readier source of water that can evaporate, condense in the upper troposphere, and thus produce the tropospheric hot spot [66 (with 488 - 490); 67, page 7]. Thus one can explain why figure 4 shows greater tropospheric warming amplification above the tropical oceans vs. above the tropical land.
Figure 4 also indicates that UAH is the only analysis lacking a hot spot [32; 37, table 4 on page 2285]. One could predict this in advance since:
- UAH has a long history of under-estimating tropospheric warming due to UAH's faulty homogenization [26, from 36:31 to 37:10; 47; 49; 53, pages 5 and 6; 123; 152; 213; 215; 260; 392 - 394; 451; 487, from 15:23 to 24:00].
- Other scientists have critiqued UAH's homogenization methods [27; 31, pages 17 - 19; 33; 34; 37 - 40; 47 - 49; 123; 152; 213; 215; 260; 392 - 394; 445; 451; 487, from 15:23 to 24:00; 505].
- UAH's satellite-based temperature analyses often diverge from analyses made by other research groups, in both the mid- to upper troposphere and other atmospheric layers [27; 31, pages 17 - 19; 33; 34; 37 - 40; 47 - 49; 51; 123; 351, pages S17 and S18; 392 - 396; 460, pages S17 and S18; also see: 476 and 486 (with 477 - 483, generated using 201 and 202); 487, from 15:23 to 24:00].
UAH is thus the odd analysis in the bunch, and likely the least credible analysis. So UAH's data analysis serves as (at best) a very weak argument for the "no hot spot" myth. As noted by the UW team members who made figure 4:
"Our amplification factor over land is reduced because of enhanced land surface warming relative to sea surface warming [...]. All of the MSU/AMSU [microwave sounding unit for determining atmospheric temperature] datasets demonstrate tropical tropospheric amplification, except UAH [emphasis added] [37, page 2285]."
Rather tellingly, UAH scientists John Christy and Roy Spencer [32; 42] have been some of the most vocal defenders of the "no hot spot" myth [8; 13 - 17; 32; 117; 158; 209; 257; 397]; Spencer and Christy may propagate the myth as a means of defending their flawed UAH analysis. In fact, myth proponents such as Judith Curry [8], Anthony Watts [54; 158], David Evans [148; 171], and The Daily Caller [19] use Christy and Spencer's claims to prop up the "no hot spot" myth [22; 159; 162]. One might wonder why these myth proponents cherry-pick the outlier UAH team, as opposed to the other satellite research groups mentioned above...
[If you are not interested in further discussion of satellite-based analyses, then I suggest skipping ahead to the next section, section 2.4. The rest of section 2.3 will explain why the UAH satellite-based analysis does not plausibly rebut the hot spot's existence.]
[If you are not interested in further discussion of satellite-based analyses, then I suggest skipping ahead to the next section, section 2.4. The rest of section 2.3 will explain why the UAH satellite-based analysis does not plausibly rebut the hot spot's existence.]
Anyway, in addition to mid- to upper tropospheric temperature, UAH and RSS also produce a satellite-based estimate of lower tropospheric temperature known as TLT [41; 42; 214; 258]. In contrast, NOAA/STAR, UMD, and UW do not produce a lower tropospheric temperature analysis [27, page 383; 47, figure 8 on page 77]. A number of myth proponents compare TLT to near-surface temperature in the tropics in order to argue against the hot spot's existence [8; 15 - 17; 24; 144 - 147; 209; 321; 322]. This method suffers from a number of problems, including:
- Scientists predict that tropical tropospheric amplification would be greater for the mid- to upper troposphere relative to the surface, than for the lower troposphere relative to the surface [26, from 31:01 to 31:48; 27; 112, page 707; 216, figure 4 on page 8]. So by only focusing on the lower troposphere, one targets on a smaller amplification ratio and thus one makes the hot spot harder to find.
- Myth defender Roy Spencer notes that satellite-based lower troposphere warming measurements may not reach high enough in the troposphere to find the hot spot [32].
- RSS' TLT and UAH's TLT under-estimate lower tropospheric warming, as admitted by the RSS team [41, page 7715; 323; 351, page S17] and shown by comparisons to other data sources [323; 351, page S17; 460, pages S17 and S18; 462, figure 10; also see: 476 and 486 (with 477 - 483, generated using 201 and 202)]. I discuss this further in section 2.2 of "Myth: Evidence Supports Curry's Claims Regarding Satellite-based Analyses and the Hot Spot".
- The more research groups there are, the greater the chance that at least one group will identify any homogenization mistakes, as acknowledged in a report Christy co-authored [191, pages 14, 42, 120, and 122]. This argues in favor of mid- to upper tropospheric analyses over TLT analyses in investigating the hot spot, since more research groups produce a mid- to upper tropospheric analysis than produce a TLT analysis [27, page 383].
To illustrate the last point: scientists need to apply a correction for satellites decaying in their orbits, and a diurnal drift correction to account for the fact that satellite measurements occur at different times of day [37; 40; 41; 123; 152; 273; 352; 451]. Since temperature at noon will likely be warmer than temperature at midnight, correcting for this time-of-day effect remains crucial for discovering any underlying tropospheric warming trends.
UAH team members Spencer and Christy noted that RSS used a flawed diurnal drift correction in one of their recent analyses [406]. RSS corrected this error [40; 41], increasing RSS' TLT post-1998 warming trend by ~40% [41; 407]. Strangely, even though Spencer knew RSS' analysis was flawed, he still recommended that people used the flawed RSS analysis instead of Spencer's own UAH analysis, if people wanted to show as little warming as possible [406].
And after RSS corrected RSS' error [40; 41], Spencer and Christy responded by changing their UAH homogenization again; this change reduced UAH's TLT warming trend [42] to below that of the flawed RSS analysis [41, pages 7711 - 7714] that Spencer and Christy had objected to [406]. In fact, the UAH TLT warming trend is now a low outlier in the scientific literature [323; 41, pages 7711 - 7714; 351, pages S17 and S18; 460, pages S17 and S18; also see: 476 and 486 (with 477 - 483, generated using 201 and 202)], on par with a re-analysis [351, page S18; 460, page S18] that is known to under-estimate warming [77; 94, section 9; 240, section 2] and less than a weather balloon analysis [41, pages 7713 and 7714] that Christy admits under-estimates warming [347], as I discuss in section 2.2 of "Myth: Evidence Supports Curry's Claims Regarding Satellite-based Analyses and the Hot Spot".
Over a decade earlier, the RSS team revealed that UAH bungled the diurnal drift homogenization in a way that spuriously reduced UAH's tropospheric warming trend [123; 152; 451]. According to UAH team members Spencer and Christy, correcting the UAH team's error increased UAH's TLT trend by ~40% [152]. RSS' own TLT warming trend at that time was even larger than this [123]. The UAH team's error occurred because the UAH team falsely assumed that the lower troposphere warmed at midnight and cooled at mid-day [152]. When Spencer and Christy admitted this error, RSS members Carl Mears and Frank Wentz offered the following priceless reply [152; 459] (highlighting added):

Or as reportedly [470] noted by Kevin Trenberth, one of Christy's supervisors in graduate school:
"[Trenberth] said he distanced himself from Christy around 2001, worried that every time a decision was called for in processing data, Christy was choosing values that gave little or no trend [470]."
(This quote is consistent with Trenberth's decades-long history of documenting Christy's distortions and correcting those who abused Christy's distortions in order to misleadingly minimize global warming [215; 260; 471 - 473])
Yes, one wonders why the UAH team adopted an obviously wrong adjustment that conveniently reduced their stated amount of TLT warming [123; 152; 451]. And one also wonders why the UAH team later changed their methods to reduce their TLT warming trend to beneath that of virtually every other analysis [41, pages 7711 - 7714; 351, pages S17 and S18; 460, pages S17 and S18; also see: 476 and 486 (with 477 - 483, generated using 201 and 202)], including two analyses [41, pages 7711 - 7714] they admitted contained a cooling bias [347; 406] (in "John Christy and Atmospheric Temperature Trends", I summarize other examples of UAH team member John Christy misrepresenting science in a politically-expedient manner). Yet many myth proponents still rely on UAH's TLT analyses to argue that tropical tropospheric warming remains too small for the hot spot to exist [8; 15 - 17; 24; 144 - 147; 209; 321; 322]. That's not much of a case against the hot spot's existence, given UAH's long history of under-estimating tropospheric warming [26, from 36:31 to 37:10; 47; 49; 53, pages 5 and 6; 123; 152; 213; 215; 260; 392 - 394; 451; 487, from 15:23 to 24:00].
Myth proponents not only fail with respect to TLT, but they also often fail when they attempt to examine mid- to upper tropospheric temperature trends. For instance, a number of myth proponents estimate mid- to upper tropospheric warming [16; 17; 20; 117; 144; 145; 159; 257] using a satellite-based analysis known as TMT [27; 40; 258]. However, TMT includes significant contributions from the lower stratosphere, a layer of the atmosphere higher than the troposphere [27; 33 - 36; 40; 214, section 4.1; 260; 261; 451]. TMT therefore contains some stratospheric cooling [27; 33 - 36; 214, section 4.1; 260; 261; 451], as I discuss in section 2.2 of "Myth: Santer et al. Show that Climate Models are Very Flawed". Scientists have known about this stratospheric contamination of TMT since at least 1997 [33; 260].
Stratospheric cooling causes TMT to under-estimate mid- to upper tropospheric warming [27; 33 - 36; 214, section 4.1; 260; 261]; the UAH team knows this [32; 42, section 7a; 276, sections 1 and 3.5; 351, page S18]. This undermines myth proponents' [16; 17; 20; 117; 144; 145; 159; 257] (such as Paul Homewood's [20]) attempts to use TMT to argue against the hot spot's existence. Different research groups account for the TMT stratospheric contribution in different ways [27; 33 - 36; 43, page 2; 44, page 2; 214, section 4.1; 261], with the exception of UAH [15, section 1; 257; 262] and UAH team member John Christy [27; 263, pages 2 - 4]. Christy [27; 263, pages 2 - 4] and the UAH team [15, section 1; 257; 262] fail to adequately correct for this cooling, since they object to the validated [261; 388 - 391] correction method used by RSS, UW, and NOAA/STAR [27; 33 - 35; 37, table 2 on page 2285; 214, section 4.1; 258; 261; 388 - 391; 395; 396]. Thus the UAH team obscures the hot spot in the mid- to upper troposphere by not adequately accounting for stratospheric cooling; this obfuscation makes it easier for UAH scientists Christy and Spencer to argue against the hot spot's existence [8; 13 - 17; 32; 117; 158; 209; 257].
To address the stratospheric cooling present in TMT, the NOAA/STAR, RSS, and UW research teams use a satellite-based analysis known as TTT. TTT better represents trends in the mid- to upper troposphere, by removing the stratospheric contribution to TMT [27; 33 - 35; 37, table 2 on page 2285; 214, section 4.1; 258; 261; 388 - 391; 395; 396]; a number of papers have validated TTT's stratospheric cooling correction [261; 388 - 391]. Figure 4 above presents TTT data from four satellite-based analyses.
RSS' TLT analysis [41, figure 9] displays amplified tropical lower tropospheric warming [259] relative to tropical near-surface warming from most {GISTEMP, NOAA [324], JMA, JRA-55 [325], ERA-I [326], NCEP-2, NCEP [327], CFSR [328], MERRA [328], and 20CR [326], with 20CR and MERRA lacking data for the last couple of years; generated using 201 and 202} (but not all {HadCRUT4, Berkeley Earth [329], and MERRA-2 [330]; generated using 201 and 202}) other analyses. And RSS' TTT analysis shows amplified tropical mid- to upper tropospheric warming relative to tropical lower tropospheric warming in their TLT analysis [27, figure 9B on page 385; 259]. Weather-balloon-based analyses and re-analyses also display this amplification, as I discuss in sections 2.4 and 2.5, respectively. UAH's analysis does not show amplification [27, figure 9B on page 385], consistent with UAH's status as an outlier among satellite-based analyses [27; 31, pages 17 - 19; 33; 34; 37 - 40; 47 - 49; 51; 123; 351, pages S17 and S18; 392 - 396; 460, pages S17 and S18; also see: 476 and 486 (with 477 - 483, generated using 201 and 202); 487, from 15:23 to 24:00]. This again illustrates that the flawed UAH analysis is the only up-to-date, satellite-based temperature record supporting the "no hot spot myth", in contrast to four other records debunking the myth [27, figure 9B on page 385; 37, table 4 on page 2285; 43].
Christy co-authored a March 2018 paper defending UAH's lower TTT trend and TMT trend [276]. I briefly critique this defense in section 2.2 of "Myth: Evidence Supports Curry's Claims Regarding Satellite-based Analyses and the Hot Spot" and in a separate multi-tweet Twitter thread [336]. This paper will not help myth proponents much, since figure 18 of the paper depicts evidence of the hot spot [276, figure 18]. Moreover, in this paper [276] Christy cites weather balloon analyses and re-analyses that show the hot spot; I discuss these analyses more in sections 2.4 and 2.5 below.
Section 2.4: Weather balloon (radiosonde) evidence
Alongside satellites, scientists also use weather balloons (radiosondes) to measure tropospheric temperature. Radiosonde temperature records can be calculated from measurements of wind or from temperature sensor readings, given the relationship between temperature gradients and wind [56 - 59; 92; 268 - 270]; this provides two methods for confirming temperature trends [56 - 59; 268 - 270].
There are at least seven radiosonde temperature records, which are as follows:
- Radiosonde Observation Correction using Reanalysis (RAOBCORE) from a team at the University of Vienna [55 - 57; 206; 286; 412; 432]
- Radiosonde Innovation Composite Homogenization from a team at the University of Vienna (RICH) [55 - 57; 286; 412; 432]
- Iterative Universal Kriging (IUKv2) from a team at the University of New South Wales [58; 59; 190; 268; 361; 362]; other sources also test and validate kriging as a method [175; 363, section 3.3; 364, pages 3749 - 3750; 365 - 372]
- Radiosonde Atmospheric Temperature Products for Assessing Climate (RATPAC) from a team at the NOAA [60; 302]
- Hadley Center Radiosonde Temperature (HadAT2) from a team at the United Kingdom Met Office [61; 62; 153; 154; 413]
- Comprehensive Historical Upper-Air Network (CHUAN) from Stickler et al. [169; 282; 283; 383]
- Integrated Global Radiosonde Archive (IGRA) from a team at the NOAA [277 - 281; 301]
RAOBCORE [206; 207], RATPAC version A [60, section 3.1; 302], and IUKv2 [58] include IGRA data. RAOBCORE and RICH also include CHUAN data (via [55; 286] an analysis known as GRASP [168; 284]). Neither IGRA nor CHUAN were included in a recent comprehensive analysis of tropical tropospheric amplification in radiosonde analyses [63]. And though an unpublished analysis showed the hot spot in CHUAN [285], I can find no recent peer-reviewed paper assessing CHUAN's tropical troposphere amplification relative to near Earth's surface. IGRA [47, page 74; 284, page 186; 301, page 1754] and CHUAN also lack important homogenization [284, page 186], and I know of no myth proponent who relies on IGRA and CHUAN to support the myth. So for these reasons I exclude IGRA and CHUAN, leaving us with 5 homogenized radiosonde analyses.
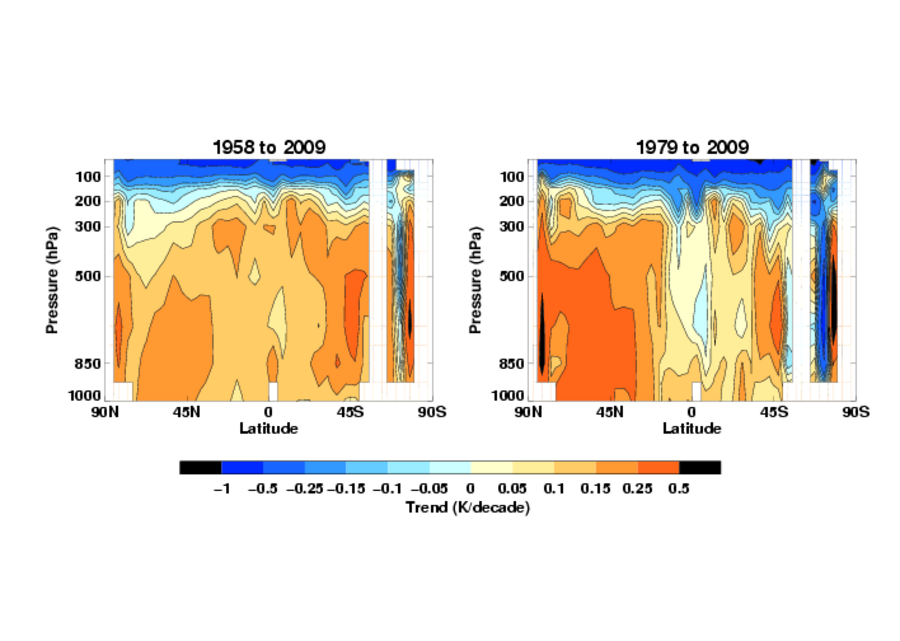
5 out of 5 radiosonde analyses show the hot spot post-1958 and 4 out of 5 radiosonde analyses show the hot spot post-1979, with greater warming in the tropical upper troposphere than near Earth's surface [56, figure 9; 58, figures 1 and 2; 63, figure 2c; 64, figure 3 and table 1; 408, figure 4; 504, figure 15] (two other radiosonde analyses published after 2020 show the hot spot as well [504, figure 15; 511, figure 10]). Radiosonde analyses also show greater warming in the tropical upper troposphere than in the lower troposphere [56, figure 9; 58, figures 1 and 2; 235, figure S6; 408, figure 4; 504, figure 15; 511, figure 10]. Upper tropospheric amplification occurs at an atmospheric pressure level of around 300hPa [58, figures 1 and 2; 63, figure 2c; 64, figure 3 and table 1; 408, figure 4; 504, figure 15; 511, figure 10], as illustrated in figure 5 using the IUKv2 record:
Figure 5: Tropical warming/cooling trend versus height for IUKv2 weather balloon measurements from 30°N to 30°S, unless otherwise noted. Pressure decreases from the Earth's surface (near the bottom of the y-axis) to the troposphere to the stratosphere (near the top of the y-axis) [58]. The tropical troposphere lies below 150hPa, while the tropical stratosphere is above 70hPa [65]. The green line extends to the beginning of satellite era of atmospheric temperature measurements (1979), while the purple line extends to before the satellite era. The inset legend for circles, diamonds, etc. indicates different temperature trends given different data analysis choices. The blue line roughly indicates the warming pattern expected for a moist adiabat [58]. |
The myth proponent John Christy cites all of the radiosonde analyses (with the exception of CHUAN) [16, page 23; 17, page 21; 76, pages 4 - 7; 98, page 1694; 116; 276; 351, figure 2.7 on page S17; 397], though he recently stopped citing HadAT2 [16, page 23; 17, page 21; 76, pages 4 - 7; 116; 276; 351, figure 2.7 on page S17]; he acknowledges that HadAT2 under-estimates tropospheric warming [347]. And of the 5 radiosonde analyses, HadAT2 is the outlier; HadAT2 shows the hot spot over some multi-decadal time periods [61, figures 10 and 11; 63, figure 2c; 64, figure 3 and table 1; 413], but not over other multi-decadal periods [61, figures 10 and 11; 63, figure 2c; 413] (see figure 8 below). This may explain why myth proponents such as David Evans [2; 6; 109; 171; 386], the Global Warming Policy Foundation [161], and C3 headlines [23; 161] rely so heavily on HadAT analyses, to the exclusion of other analyses.
One should treat the HadAT2 result with skepticism, however, given some deficiencies in the homogenization for HadAT [153 - 155] and HadAT2 [63; 154]. The HadAT/HadAT2 team acknowledges these deficiencies [63; 153 - 155]. So the HadAT/HadAT2 research group strongly recommends that researchers not rely on just the HadAT2 data-set. Instead, the team recommends that researchers use other radiosonde data-sets, along with the RSS satellite analysis [62], to ensure that their result is robust. Since the hot spot appears in the other radiosonde analyses [56, figure 9; 58, figures 1 and 2; 63, figure 2c; 64, figure 3 and table 1] and the RSS analysis [27, figure 9B on page 385; 37, table 4 on page 2285], HadAT2's lack of a hot spot (over some time periods) is not a robust result. So HadAT2 and HadAT provide little support for the hot spot myth, contrary to the claims of David Evans [2; 6; 109; 171; 386].
Evans also usually cherry-picks older analyses which contain more heterogeneities and which include data from just 1979 - 1999 [1; 2; 5 - 7; 109; 149; 171] (see figure 7 below). This allows him to evade the multi-decadal time periods in which HadAT2 shows the hot spot [61, figures 10 and 11; 63, figure 2c; 64, figure 3 and table 1] (ex: compare figures 7 and 8 below). He defends this practice in at least four ways.
Evans' first defense states that the 1979 - 1999 HadAT2 analysis is "the only image as a function of height and latitude ever publicly released, apparently [171]." He offered this defense in November 2015 [171]. In 2012, Evans used a similar claim to make conspiracy-theory-laden insinuations about the United States Climate Change Science Program (CCSP):
"This important and pivotal data was not released publicly by the climate establishment until 2006, and then in an obscure place [...]. [...] The weather balloon data showing the atmospheric warming pattern was finally released in 2006, in the US Climate Change Science Program [...] This is the only data there is. [By the way], isn’t this an obscure place to release such important and pivotal data – you don’t suppose they are trying to hide something, do you [203]?"
Yet before Evans made his 2012 and November 2015 statements, scientists published images showing tropical atmospheric warming patterns [55, figure 11; 56, figure 9; 58, figures 1 and 2; 59, figure 3; 60, figures 4 and 6; 61, figures 10 and 11; 89, figure 7; 90, figure 1; 190, figures 3 and 6]. This included 2005 RATPAC [60, figures 4 and 6] and HadAT2 [61, figures 10 and 11] images published before Evans' 2006 CCSP image [171]. And the CCSP report [191] that Evans discusses [203] cites [191, pages 52, 149, 151, 153, 155, and 162] the sources for both of those 2005 images [60; 61]. So Evans has no excuse for not being aware of the 2005 images [171], and for insinuating that the CCSP tried to hide the data [203]. Evans' partner Joanna Nova, another myth proponent, also therefore has no excuse for her fabricated claim that HadAT/HadAT2 "was the only dataset the CCSP used [401]." The CCSP cites and uses numerous other datasets [191, page 52].
Figure 6 shows a 2005 RATPAC image, figure 7 depicts the 2006 image that Evans habitually presents, figure 8 shows a 2005 HadAT2 image, and figure 9 shows a 2015 IUKv2 image that Evans objects to [172]:
 |
Figure 6: Warming/cooling trend versus height for RATPAC weather balloon measurements from 1979 - 2004 [60, figure 4]. Pressure decreases from the Earth's surface (near the bottom of the y-axis) to the troposphere to the stratosphere (near the top of the y-axis). The tropical troposphere lies below 150hPa, while the tropical stratosphere is above 70hPa [65]. |
 |
Figure 7: Evans' image [1, page 4] taken from a 2006 report of the US Climate Change Science Program (CCSP). This image displays warming/cooling trend versus height for HadAT2 weather balloon measurements from 1979 - 1999 [191, figure 5.7 on page 116]. Pressure decreases from the Earth's surface (near the bottom of the y-axis) to the troposphere to the stratosphere (near the top of the y-axis). The tropical troposphere lies below 150hPa, while the tropical stratosphere is above 70hPa [65]. Temperature trends in °C/decade are equivalent to trends in K/decade. |
 |
Figure 8: Top two panels: Warming/cooling trend (in K/decade) versus height for HadAT2 weather balloon measurements. Crosses indicate trends statistically distinguishable from 0 [61, figure 11]. Pressure decreases from the Earth's surface (near the bottom of the y-axis) to the troposphere to the stratosphere (near the top of the y-axis). The tropical troposphere lies below 150hPa, while the tropical stratosphere is above 70hPa [65]. Bottom two panels: Estimate of some of the uncertainty (in K/decade) at atmospheric pressure levels corresponding to the top panel images [61, figure 11]. |
Figure 9: Warming/cooling trend (in K/decade) versus height for IUKv2 weather balloon measurements from 1960 - 2012. The temperature trends are not derived from wind measurements, and southern latitudes are marked as negative [58, figure 1]. Pressure decreases from the Earth's surface (near the bottom of the y-axis) to the troposphere to the stratosphere (near the top of the y-axis). The tropical troposphere lies below 150hPa, while the tropical stratosphere is above 70hPa [65]. |
The differences between the images largely stem from differences in the color-coding used for temperature trends, in the homogenization method employed, and in the time-frame selected. For example, HadAT2 figure 8 shows greater upper tropospheric warming from 1958 - 2002 than from 1979 - 2002. This likely stems from 1980s changes in radiosonde equipment; this heterogeneity artificially increases 1980s radiosonde temperature measurements for the tropical upper troposphere [165; 166; 204; 205; 207], as I discuss in "Myth: The CCSP Presented Evidence Against the Hot Spot's Existence".
While RATPAC figure 6 partially homogenizes this 1980s warm bias, HadAT2 figures 7 and 8 do not adequately address this 1980s heterogeneity. In contrast, IUKv2 figure 9 addresses the heterogeneity to the point that there is little difference between IUKv2's 1959 - 2012 and 1979 - 2012 trends (see figure 5). In performing this homogenization, the IUK team could learn from over a decade of scientific research validating different homogenization methods [ex: 155; 205; 207]. Much of this research came after figures 6, 7 and 8, and thus this research did not beneficially inform the homogenization used in figures 6, 7 and 8. In contrast, this research did inform the homogenization used for figure 9. These research-based homogenization improvements revealed a post-1979 hot spot in every radiosonde analysis (as of 2017), other than HadAT2 [63, figure 2c]. So there is good reason to trust the 2015 IUKv2 figure 9 more than the 2006 HadAT2 figure 7 that covers 1979 - 1999.
[If you are not interested in a point-by-point rebuttal of David Evans' position on the hot spot, then I suggest skipping ahead to the next section, section 2.5. The rest of section 2.4 will rebut Evans' attempt to use cherry-picking to argue against the hot spot's existence.]
Unfortunately, Evans opts for figure 7, with its shorter time-frame of 1979 - 1999 and its color-coding that mutes the hot spot's increasing tropical tropospheric warming with increasing height. This is rather ironic, since Evans complains that IUK's color-coding [172; 190, figure 6] exaggerates the warming [1, page 11]. And since Evans is aware [1, page 11; 172] of some of the pre-November-2015 IUK images [58, figures 1 and 2; 59, figure 3; 190, figures 3 and 6], he is knowingly misleading his audience when he claims that figure 7 is "the only image as a function of height and latitude ever publicly released, apparently [171]."
Thus, Evans' first defense collapses because he intentionally under-estimates how much information is available on the hot spot. He should also drop his insinuation that the United States CCSP was "trying to hide [203]" radiosonde information relevant to the hot spot. The 2006 CCSP cited [191, pages 52, 149, 151, 153, 155, and 162] the 2005 radiosonde analyses [60; 61] shown in figures 6 and 8 above. Evans likely missed this because he did not bother to read the CCSP report closely, despite Evans discussing the report at length on multiple occasions [1; 2; 4 - 6; 109; 148; 149; 171; 172; 189; 203]. And one could easily examine radiosonde analyses in the scientific literature before the CCSP published their 2006 report [61; 65] (ex: see figures 6 and 8 above); Evans probably missed these analyses because he does not know how to do a competent literature review. This despite the fact that the HadAT2 team explicitly states that when citing the HadAT2 analysis, people should cite the 2005 paper that includes figure 8 above [62].
In his second defense, Evans claims that since there has been no surface warming from 1999 (or 2001) to 2014, he does not need to include radiosonde data from after 1999 [1, page 5;171, comment #17.2; 172]. This defense fails for at least five reasons:
- Earth's surface warmed since 1999 [94; 173 - 188], and radiosonde analyses show the tropics warmed since 1999 [63, figure 3] (for more on this, see my post "Myth: No Global Warming for Two Decades").
- Evans' defense does not justify his exclusion of pre-1979 data, since his explanation only applies to post-1999 data. But Evans should include pre-1979 data. To see why, note that Evans cites model-based tropospheric projections from 1958 - 1999 [1, pages 3 - 7; 2; 5; 6; 109; 171; 172] (or from 1890 to 1999 [1, page 8; 5; 149]), and then compares those projections to a HadAT2 analysis from 1979 - 1999 [1, pages 3 - 7; 2; 5; 6; 109; 149; 171; 172]. But that is a flawed comparison, since he needs to look at 1958 - 1999 radiosonde data in order to do a comparison to 1958 - 1999 projections. So Evans needs to include pre-1979 data. Alternatively, Evans could compare 1979 - 1999 observations with 1979 - 1999 projections, as his cited source [1, page 4] (the CCSP) did [191, figure 5.7 on page 116]. But doing that would greatly (and justifiably) reduce [191, figure 5.7 on page 116] Evans' depicted discrepancies between models and observations [1, pages 3 - 7; 2; 5; 6; 109; 149; 171; 172]. So Evans chooses not to perform this more accurate analysis, and instead opts for a flawed comparison [1, pages 3 - 7; 2; 5; 6; 109; 149; 171; 172] in order to misleading exaggerate the model-observations discrepancy (I discuss this in more detail in "Myth: The CCSP Presented Evidence Against the Hot Spot's Existence").
- Since scientists have at least 54 years worth of radiosonde data from 1959 to 2012 [58; 63] (ex: see figure 5), Evans' 21 year period uses less than half of the data. His smaller sample size makes his result less statistically robust and more prone to the effects of random noise [94, figure 3; 410; 411, page 194]; analogously, one is more likely to get a 2:1 heads-to-ratio, by chance, for 21 coin flips of a fair coin versus 54 flips of the same fair coin.
- Evans' defense does not explain why one should exclude all the data from before 1979 and from after 1999. For example, his defense does not show any deep flaws present in the pre-1979 and post-1999 data, but not present in the 1979 - 1999 data. So even if the post-1999 data contains no warming, Evans has not shown that including the post-1999 data would do any harm. And since including the post-1999 would make Evans' analysis more statistically robust and less prone to random noise, Evans should include the post-1999 data.
- Evans' favored HadAT2 analysis does not adequately address the instrument-change-based heterogeneity that caused 1980s tropical upper tropopsheric temperature measurements to be artificially high [165; 166; 207]. This heterogeneity biases Evans' 1979 - 1999 trend more than it would bias a longer trend such as 1959 - 1999 or 1959 - 2012. So Evans' shorter trend remains particularly susceptible to bias by heterogeneities.
Evans' third defense involves claiming that the amount of warming for the predicted hot spot is much greater than the radiosonde's limits of temperature detection [1, pages 1, 5, and 10; 5]. But Evans response lacks merit because the heterogeneities in question are not exclusively about the sensitivity of radiosondes in detecting slight temperature differences. Instead, the heterogeneities include changes in radiosonde design overtime, solar radiation directly heating inadequately shielded radiosondes such that the radiosondes are not just measuring air temperature, etc. [155; 165; 166; 167, pages 23 - 25; 169; 170; 191, pages 74 and 121; 204 - 208]. These heterogeneities are often greater than the error value given by Evans [1, pages 1, 5, and 10; 5]. Therefore scientists correct for these heterogeneities, with various degrees of success, resulting in the five homogenized radiosonde temperature records mentioned above [55; 57; 58; 60; 61; 168; 170; 204 - 208; 412, slide 30]. So Evans' third defense fails since he mischaracterizes the nature of the heterogeneities and he under-estimates the need for homogenization.
In his fourth defense, Evans insinuates that "raw" radiosonde analyses are preferable to homogenized radiosonde analyses [172; 189]. Evans' insinuation is off-base, since raw/un-homogenized analyses would contain large heterogeneities that would obscure climate-related trends in the data [155; 165; 166; 167, pages 23 - 25; 169; 170]. This is why informed climate scientists avoid using un-homogenized records or records with older, inferior homogenization [55; 57; 58; 60; 61; 63; 168; 170]. Scientists embarrass themselves if they do otherwise. For instance: for years, myth proponents Spencer and Christy under-estimated tropospheric warming because their UAH homogenization failed to adequately account for decaying satellite orbits [26, from 36:31 to 37:10; 47; 49; 53, pages 5 and 6; 123; 152]. Evidently Evans did not learn from Spencer and Christy's mistake. Nor did he learn from Christy's statement that HadAT2 under-estimates tropospheric warming [347].
And, ironically, Evans' data sources are homogenized. For example, he cites UAH's homogenized satellite-based analysis [148; 171; 203], he admits to using radiosonde analyses that are adjusted to account for ice sticking to the radiosondes [1, page 5], and he relies on (inadequately) homogenized HadAT or HadAT2 analyses [1; 2; 5 - 7; 109; 149; 171]. So Evans cites (inadequately) homogenized analyses when they suit his purposes [1; 2; 5 - 7; 109; 149; 171]; but he then insinuates that the analyses are "raw", when he needs to cast doubt on homogenized analyses that rebut his position [172; 189; 434].
(Apparently, Evans also falsely believes that the hot spot is the rise of the tropopause [3; 414; 415], an atmospheric layer above the troposphere [65; 305]. That has unfortunate implications for Evans' position, since Evans denies that the hot spot exists [1 - 7; 109; 148; 149; 171; 172; 189; 193; 203; 386], even though the tropopause rose both globally and in the tropics [93; 416 - 419, generated using 201 and 202 (based on a tropical tropopause at an atmospheric pressure level of 150mb or 150hPa, as defined by: 56; 65; 420; 421); 422 - 428; 453].)
Radiosonde data and satellite data, along with other data sources, are also incorporated into temperature re-analyses [77 - 94; 120]. These re-analyses help generate a broader picture of global temperature using a wealth of data [120; 134]. A number of myth proponents (including Judith Curry [106], John Christy [15; 76, pages 4 - 7; 116; 245, pages S16 and S17; 276; 431, page 104; 460, pages S17 and S18], Roy Spencer [255; 276], Roger Pielke Sr. [15; 95; 115], and Anthony Watts [12]) cite tropospheric warming trends from re-analyses, while David Evans links the hot spot to upper tropospheric humidity trends from a re-analysis [2; 171; 193]. So it would be worthwhile to see if the re-analyses support the "no hot spot" myth.
There are at least eight re-analysis groupings, with each grouping having different re-analysis versions and updates [120; 134]. The homogenized groupings are as follows:
- European Centre for Medium-Range Weather Forecasts' Interim re-analysis (ERA-I) [77; 78; 380; 400; 402; 444; 461]
- Modern-Era Retrospective analysis for Research and Applications (MERRA) [79; 80; 375; 376]
- National Centers for Environmental Prediction / Climate Forecast System Re-analysis (CFSR or NCEP/CFSR) [81; 82; 381; 382]
- Japan Meteorological Agency Re-analysis (JRA) [83 - 85; 373; 374; 504, figure 15]
- National Centers for Environmental Prediction / National Center for Atmospheric Research / Department of Energy re-analysis (NCEP a.k.a. NCEP/NCAR, or NCEP-2 a.k.a. NCEP/DOE) [86 - 88; 378; 379]
- 20th Century Re-analysis (20CR) [135; 377; 469; 494; 496; 504, figure 15]
- European Centre for Medium-Range Weather Forecasts' Atmospheric Reanalysis of the 20th century (ERA-20C) [495 - 497]
- European Centre for Medium-Range Weather Forecasts' Coupled Reanalysis of the 20th Century (CERA-20C) [491 - 493]
(You can access re-analysis data using two free online tools [201; 202; 437]. I do not present such an analysis here and instead rely on published, peer-reviewed analyses that show better familiarity with possible issues with the re-analyses than I would.
One can also use the online tool [201; 202] to compare the re-analyses with the validated [305; 352; 454] 2001 - 2016 GPS RO tropical upper tropospheric warming trends from figure 3. In comparison to GPS RO at atmospheric pressures of 200hPa and 250hPa {slightly above an altitude of ~10km in the tropics}: ERA5 [454; 455], ERA-I [353; 454], MERRA-2 [354], JRA-55 [355], and MERRA [356] show less warming, NCEP [357] has slightly less warming, NCEP-2 [358] shows roughly the same amount of warming, and CFSR [359] has more warming. The 20CR re-analysis stops before 2015 [360], and thus cannot be compared with the 2001 - 2016 GPS RO analysis [305].)
20CR [120; 134, page 1423; 135, section 8], ERA-20C [495; 497], and CERA-20C [491 - 493] only incorporate surface data, and thus may not be very useful for examining mid- to upper tropospheric warming trends [134, page 1423] (though a 20CR analysis is available [125, figure 6; 201]). So let's set aside these three re-analyses. That leaves us with five re-analysis groupings.
4 out of 5 re-analyses show the hot spot, with greater warming in the tropical upper troposphere than near Earth's surface [77, figure 23 on page 348 and section 10.2.2 on page 351; 89, figure 7; 90, figure 1; 91, figure 4; 92, figure 4; 239, figure 1; 408, figure 4; 504, figure 15]. Upper tropospheric amplification occurs at an atmospheric pressure level of around 300hPa, as depicted in figure 10 for three of the re-analyses:
 |
Figure 10: Tropospheric warming trend from 1979 - 2012 for the entire tropics (blue line; from 30°N to 30°S), tropical land (green line; from 30°N to 30°S), and the Sahara desert (red line). The Sahara's red line is not relevant for our purposes, since the Sahara is too arid to behave like a moist adiabat. The horizontal axis represents the warming trend in K per 34 years. The vertical axis represents altitude, with decreasing atmospheric pressure as altitude increases [89, figure 7]. |
As illustrated in figure 10, NCEP-2 shows greater warming in the lower tropical troposphere than in the upper troposphere [89, figure 7; 91, figure 4]. This NCEP-2 trend should be taken with a grain of salt, since the NCEP re-analysis has a history of under-estimating tropospheric warming [90; 93; 99]. Other re-analyses, such as MERRA and ERA-I (see figure 10), tend to have more upper tropospheric warming than NCEP-2 [89, figure 7] (and NCEP [91, figure 4]) and tend to perform better than NCEP-2 [100; 196; 319; 320; 498 - 500] (and NCEP) when it comes to representing atmospheric phenomena [90; 91; 99; 101 - 105; 113; 122; 151; 194; 196 - 198; 499; 500], with a couple of short-term exceptions [199]. Of particular relevance to the hot spot is the fact that ERA-I performs better than NCEP-2 with respect to latent heat transport in the tropics [498 - 500]. NCEP [90; 103; 105; 113; 122; 134, page 1422] and NCEP-2 [102; 105; 113; 122; 134, page 1422] also perform poorly in comparison to CFSR, with a few exceptions [195; 199]. CFSR shows the hot spot [90, figure 1; 91, figure 4], as do MERRA [89, figure 7; 90, figure 1; 91, figure 4] and ERA-I [77, figure 23 on page 348 and section 10.2.2 on page 351; 89, figure 7; 90, figure 1; 91, figure 4; 239, figure 1; 440, figure 1c]. So the better-performing re-analyses show the hot spot.
Given the aforementioned deficiencies in NCEP-2, one should consider relying on another re-analysis instead of NCEP-2 [114; 119]. This may explain why myth defender John Christy does not cite NCEP-2, but does cite ERA-I, MERRA-2, and JRA-55 [76, pages 4 - 7; 116]. Yet Anthony Watts mistakenly relies on the NCEP-2 re-analysis as evidence against the hot spot's existence, to the exclusion of other re-analyses and without Watts noting NCEP-2's deficiencies [12]. Thus Watts unjustifiably cherry-picks the NCEP-2 re-analysis. A similar point applies to Evans' use of NCEP trends [2; 171; 193].
In contrast to NCEP-2 [157], ERA-I shows greater warming near the tropical surface than in the lower troposphere [89, figure 7; 91, figure 4; 239, figure 1], as shown in figure 10. This is because ERA-I under-estimates the rate of lower tropospheric warming, as acknowledged by the ERA-I research team [77; 94, section 9] and other researchers [240, section 2]. ERA5, the update to ERA-I [400; 402; 444; 454; 461], addresses this issue [460, page S18]. And as with ERA-I [77, figure 23 on page 348 and section 10.2.2 on page 351; 89, figure 7; 90, figure 1; 91, figure 4; 239, figure 1; 440, figure 1c], ERA5 shows the upper tropospheric hot spot [400, slide 13; 438, generated using 437; 454; 456], as shown by the ERA-I team [400, slide 13], among others [438, generated using 437; 454].
ERA-I is particularly damaging to the position of myth proponent Judith Curry, since Curry defends the "no hot spot" myth [8] and promotes the myth on her blog Climate Etc. [8; 147], even though Curry lauds [106; 452] the ERA-I analysis that shows the hot spot [77]. Yet Curry does not acknowledge the hot spot in ERA-I, as far as I know. So Curry may not realize that her own source refutes her position.
Myth defender John Christy has an even worse conundrum since he defends the "no hot spot" myth [16; 17; 76, page 10], even though he cites re-analyses, satellites analyses, and radiosonde analyses [16; 17; 76, pages 4 - 7; 98, page 1694; 116; 431, page 104] that show the hot spot [27, figure 9B on page 385; 37, table 4 on page 2285; 56, figure 9; 58, figures 1 and 2; 63, figure 2c; 77; 89]. The hot spot even appears in a figure made by Christy [116; 276, figure 18]. So Christy is aware that the hot spot exists, but he claims that it does not exist (I discuss this more in "Myth: John Christy Thinks There is No Evidence of the Hot Spot"). Thus one of the most cited proponents of the "no hot spot" myth [8; 13 - 17; 19; 22; 54] is well-aware that the myth is nonsense. Amazing.
(In "John Christy and Atmospheric Temperature Trends", I summarize other examples of Christy misrepresenting science in politically expedient ways)
In addition to estimating tropospheric warming using re-analyses, satellite data, and radiosonde data, scientists can also use other methods to indirectly test for the hot spot, as the CCSP recommends [191, page 122]. For example, scientists can look for the hot spot's predicted effects on tropical precipitation and convection: during the period of post-1970s global warming, tropical precipitation and convection patterns changed in a way indicative of a moist-adiabatic lapse rate reduction, as shown in a 2010 paper [45 (as cited in 242, page 651; 348, section 4; 349, sections 1, 5, and 6; 350); 467]. A subsequent 2011 paper disputed this finding [121 (as cited in 348, section 1)], though a 2012 paper [97 (as cited in 242, page 651; 349, sections 1, 5, and 6)] supported the results from the 2010 paper [45], as did a 2017 paper [441], a 2018 paper [442] and a 2023 paper [510].
Tropical cyclones are one example of tropical precipitation and convection patterns in action. Since the hot spot should affect tropical precipitation and convection patterns, the hot spot should also influence tropical cyclones [90; 92; 218, section 3; 229, page 1; 439]. To see why, first note that wind shear limits the formation of tropical cyclones [92; 218; 229 - 234; 244; 439] and causes a shift in where these storms form [92; 228]. Increased wind shear comes with upper tropospheric warming [56; 59; 92; 244; 467]. So the hot spot's upper tropospheric warming should coincide with a shift in where tropical cyclones form [92] and with reduced tropical cyclone frequency [90; 92; 218, section 3; 229, page 1; 244; 439], consistent with previous research on how global warming decreases tropical cyclone frequency [91, page 2290; 219 - 223; 238; 446]. Some studies, however, argue that surface warming will not decrease tropical cyclone frequency [242, page 650] (upper tropospheric warming should not increase tropical cyclone intensity [91, section 3; 227; 439; 468], though sea surface warming should increase this intensity [220; 222; 224 - 227; 238; 439]).
The predicted decrease in tropical cyclone frequency need not be global, however, given the different atmospheric factors governing different regions [243; 244]. For instance, tropical cyclone frequency was predicted to decrease in the west North Pacific, but not the North Atlantic [243]. Some research failed to find a significant, long-term decrease in frequency globally and in the North Atlantic [90; 224 - 226]. A larger body of studies, however, revealed the predicted decrease in frequency [92; 218; 223; 229 - 231; 232, figure 4; 233; 234] and changes in where tropical cyclones form [92; 230], especially in the west North Pacific [92; 218; 229 - 231; 232, figure 4; 233; 234; 244]. These changes indirectly support the hot spot's existence [92].
A 2018 paper could not fully account for the decreased frequency in terms of NCEP's tropical upper tropospheric warming [218]. But, as previously mentioned in section 2.5, this likely results from NCEP under-estimating tropospheric warming and thus failing to accurately represent phenomena related to tropical cyclones [90; 91; 99]. Other re-analyses show that upper tropospheric warming likely accounts for much of the observed change in tropical cyclone frequency and location [92], consistent with a number of published results [229, page 1]. Figure 11 illustrates this point by displaying re-analysis trends from a region (the west North Pacific) in which the hot spot formed [92, figure 4b; 440] in conjunction with latent heat release [236, figure 10d on page 11 and page 12; 440], decreased tropical cyclone frequency [92; 218; 229 - 231; 232, figure 4; 233; 234; 446], and a shift in where tropical cyclones form [92; 230]:
 |
Figure 11: Tropical warming/cooling trend (in K/decade) for July - November for the west North Pacific basin (trends averaged over longitudes from 145°E to 170°W) from 1979 - 2012, as derived from multiple re-analyses. The re-analyses are NCEP, NCEP-2, CFSR, ERA-I, MERRA, JRA-25, and 20CR. The black contour lines, and their adjacent numbers, represent mean temperature in K. Pressure decreases from the Earth's surface (near the bottom of the y-axis) to the troposphere to the stratosphere (near the top of the y-axis) [92, figure 4b]. The tropical troposphere lies below 150hPa, while the tropical stratosphere is above 70hPa [65]. |
Further research on tropical cyclone frequency and location should yield more clarity on these indirect tests of the hot spot's existence.
3. Posts Providing Further Information and Analysis
- Section 3.1 of part 1 of "John Christy and the Tropical Tropospheric Hot Spot"
- "Myth: The Tropospheric Hot Spot is a Fingerprint of CO2-induced Warming"
- Sections 3.1 and 3.2 of "John Christy, Climate Models, and Long-term Tropospheric Warming"
- Section 3.1 of part 1 of "John Christy and the Tropical Tropospheric Hot Spot"
- "Myth: The Tropospheric Hot Spot is a Fingerprint of CO2-induced Warming"
- Sections 3.1 and 3.2 of "John Christy, Climate Models, and Long-term Tropospheric Warming"
No comments:
Post a Comment