- The Myth and Its Flaws
- Context and Analysis (divided into multiple sections)
- Posts Providing Further Information and Analysis
- References
This is the "+References" version of this post, which means that this post contains my full list of references and citations. If you would like an abbreviated and easier to read version, then please go to the "main version" of this post.
References are cited as follows: "[#]", with "#" corresponding to the reference number given in the References section at the end of this post.
1. The Myth and Its Flaws
The climate scientist Ben Santer recently co-authored a paper on climate models [1]. In that paper, Santer and his co-authors showed that models over-estimated recent atmospheric warming, thereby revealing a deep flaw in the models. The climate models likely exaggerated carbon-dioxide-induced atmospheric warming, thus vindicating claims made by the climate scientist John Christy and United States senator Ted Cruz.
Different myth proponents accept different parts of the above myth. The Daily Caller's Ryan Maue and Michael Bastasch [2; 3], along with Ned Nikolov [106], imply that the models over-estimated the warming due to a flaw in the models; the Australian's Graham Lloyd concurs [4]. Judith Curry, Maue, and Bastasch state that Santer's co-authored paper vindicates Christy and Cruz's claims [2; 3; 5]. And Roger Pielke Sr. takes the myth further by attributing the over-estimation to the models exaggerating carbon dioxide's (CO2's) effect on climate [6; 7]:

Figure 1: A portion of a tweet from Pielke Sr., in which Pielke Sr. comments on Santer's co-authored paper [6].
The myth's flaws: According to Ben Santer's co-authored paper, observed atmospheric warming does not show that climate models over-estimate CO2-induced warming [1, pages 482 and 483]. So Santer's paper contradicts claims made by John Christy [8, page 379; 26, pages 3 and 4] and Ted Cruz [13, pages 1 - 4] regarding the models. In fact, Santer's paper explicitly argues against Christy's position [1, pages 482 and 483], consistent with Santer's previously published work [8] and points made by other scientists [268; 269; 276]. This makes sense, given Christy's long history of falsely claiming that climate models are in error, while he willfully ignores more plausible, evidence-based explanations [1, pages 482 and 483; 8, page 379; 13; 51, page 2; 59; 60; 83, from 36:31 to 37:10; 84, pages 5 and 6].
Santer's paper also argues that there are errors in the climate information inputted into the climate models, and these input errors (not an error in the models themselves) account for much of the difference between observed atmospheric warming vs. the amount of atmospheric warming projected by climate models [1]. This conclusion fits with the results of other studies, including research on the role of input errors in model-based projections of near-surface warming [22; 24; 33 - 35; 179, figure 7; 320; 338 (with 337)]. In his peer-reviewed research for a more scientifically literate audience, Christy admits that he cannot fully discount Santer's input errors explanation [91, page 517]. But when Christy speaks to Congress [156, page 43] and the general public, he instead pretends that the scientific method requires rejecting Santer's explanation, in favor of model error as an explanation [156, page 43; 195, page 8; 257, from 21:45 to 22:28], and that scientists disingenuously ignore model error in order to keep getting money [257, from 15:50 to 16:11, and 21:45 to 22:28].
(The beginning of section 2.5 below summarizes some arguments against Christy's position and in favor of Santer et al.'s position, along with listing the sections of this blogpost that further explain those arguments)
The climate scientist Ben Santer recently co-authored a paper on climate models [1]. In that paper, Santer and his co-authors showed that models over-estimated recent atmospheric warming, thereby revealing a deep flaw in the models. The climate models likely exaggerated carbon-dioxide-induced atmospheric warming, thus vindicating claims made by the climate scientist John Christy and United States senator Ted Cruz.
Different myth proponents accept different parts of the above myth. The Daily Caller's Ryan Maue and Michael Bastasch [2; 3], along with Ned Nikolov [106], imply that the models over-estimated the warming due to a flaw in the models; the Australian's Graham Lloyd concurs [4]. Judith Curry, Maue, and Bastasch state that Santer's co-authored paper vindicates Christy and Cruz's claims [2; 3; 5]. And Roger Pielke Sr. takes the myth further by attributing the over-estimation to the models exaggerating carbon dioxide's (CO2's) effect on climate [6; 7]:
 |
Figure 1: A portion of a tweet from Pielke Sr., in which Pielke Sr. comments on Santer's co-authored paper [6]. |
The myth's flaws: According to Ben Santer's co-authored paper, observed atmospheric warming does not show that climate models over-estimate CO2-induced warming [1, pages 482 and 483]. So Santer's paper contradicts claims made by John Christy [8, page 379; 26, pages 3 and 4] and Ted Cruz [13, pages 1 - 4] regarding the models. In fact, Santer's paper explicitly argues against Christy's position [1, pages 482 and 483], consistent with Santer's previously published work [8] and points made by other scientists [268; 269; 276]. This makes sense, given Christy's long history of falsely claiming that climate models are in error, while he willfully ignores more plausible, evidence-based explanations [1, pages 482 and 483; 8, page 379; 13; 51, page 2; 59; 60; 83, from 36:31 to 37:10; 84, pages 5 and 6].
Santer's paper also argues that there are errors in the climate information inputted into the climate models, and these input errors (not an error in the models themselves) account for much of the difference between observed atmospheric warming vs. the amount of atmospheric warming projected by climate models [1]. This conclusion fits with the results of other studies, including research on the role of input errors in model-based projections of near-surface warming [22; 24; 33 - 35; 179, figure 7; 320; 338 (with 337)]. In his peer-reviewed research for a more scientifically literate audience, Christy admits that he cannot fully discount Santer's input errors explanation [91, page 517]. But when Christy speaks to Congress [156, page 43] and the general public, he instead pretends that the scientific method requires rejecting Santer's explanation, in favor of model error as an explanation [156, page 43; 195, page 8; 257, from 21:45 to 22:28], and that scientists disingenuously ignore model error in order to keep getting money [257, from 15:50 to 16:11, and 21:45 to 22:28].
(The beginning of section 2.5 below summarizes some arguments against Christy's position and in favor of Santer et al.'s position, along with listing the sections of this blogpost that further explain those arguments)
2. Context and Analysis
Section 2.1: Factors influencing model-based trends and observational analyses
Skip to section 2.2 after looking at figure 2, if you already understand how observational error / observational uncertainty, internal variability, and errors in inputted forcings can explain differences between model-based projections vs. observational analyses, without implying a flaw in the models. If you do not understand this, or if what I just said sounds like scientific gibberish to you, then section 2.1 is for you.
The following analogy may help in understanding this myth [415, pages 92 - 94; 416 - 418; 419, from 0:00 to 4:15]:
Suppose Harvey generates a model that predicts coin flips; if you input information into the model, then the model will predict the number of heads and tails you will get from your coin flips. You can input conditions such as how many times you flipped the coin, whether the coin is fair or slightly loaded on one side of the coin, etc.
So suppose Yomotsu tells Harvey that Yomotsu's coin is fair/unloaded and that Yomotsu flipped the coin 40 times. Harvey inputs this information into his model and then runs the model on his computer 10,000 times, generating an output of 10,000 individual model runs. A small number of these runs generate ratios such as "29 heads, 11 tails" or "15 heads, 25 tails". But the average of the model runs is "20 heads, 20 tails."
Then Yomotsu claims he flipped his fair coin 40 times, and ended up with a ratio of 12 heads to 28 tails. This differs from the "20 heads, 20 tails" average for Harvey's model runs. There are multiple possible explanations for the discrepancy between Harvey's model average and Yomotsu's claims. These explanations include:
- Observational uncertainty: There is error or uncertainty with respect to Yomotsu's reported observations, and this error/uncertainty affects Harvey's comparison of his model's output with Yomotsu's reported observations. For instance, Yomotsu may have misremembered the number of heads and tails for his 40 coin flips. This explanation implies a flaw in Yomotsu's reported observations, but not necessarily a flaw in Harvey's model.
- Error in the inputs: This explanation implies an error in the information inputted into Harvey's model; this leads to the model generating incorrect output. So, for example, Yomotsu's coin may be loaded on one side and thus not fair, despite Yomotsu's claims to the contrary. If this loading was provided as input for Harvey's model, then his model could have generated a more accurate prediction. The error would then be with Yomotsu's inputted claims, not Harvey's model.
- Natural variability and/or model uncertainty: Yomotsu's results may be real, but due to chance. Chance does not mean magic or something unnatural, since one can (in principle) give a scientific explanation for why each flip came up the way it did. This explanation would include information about the motion of Yomotsu's hand during each flip, differences in air pressure as the coin moved through the air, etc. These natural phenomena underlie the natural variability that results in chance fluctuations in the ratio of heads-to-tails. Chance fluctuations will affect smaller sample sizes more than larger sample sizes; for instance, one is more likely to get (by chance) 3 heads with 5 flips of a fair coin vs. getting 30,000 heads in 50,000 flips of said coin, despite the fact that these are both 3-to-5 ratios. So unlikely results can occur by chance, especially in smaller sample sizes. Even Harvey's model output illustrates this point, since some of his 40-flip model runs produced unlikely results; this yields model uncertainty, where individual model runs can differ from the model average. Thus natural variability contributes to model uncertainty. Even accurate models can have this model uncertainty due to natural variability / chance. And both model uncertainty and natural variability can account for why Yomotsu's results differ from Harvey's model average, even if Harvey's model is correct.
- Model error: On this explanation, Yomotsu's results differ from Harvey's model average because of an error in Harvey's model. Harvey's model, for example, may contain inaccurate equations relating a coin's geometry to the coin's flight through the air during a coin flip.
(See the work of potholer54 / Peter Hadfield for a similar example. His example involves natural variability from daily or weekly weather, in the context of a projection of multi-month warming from mid-winter to mid-summer based on a model of Earth's axial tilt relative to the Sun [148, from 6:20 to 14:26].)
Note that the first three explanations explain Yomotsu's claims without implying a flaw in Harvey's model, while only the fourth explanation implies a flaw in Harvey's model. Furthermore, these explanations are not mutually exclusive, since these four explanations could all simultaneously contribute to the difference between Harvey's model average and Yomotsu's reported results.
Just as Yomotsu's claims diverged from Harvey's model-based projections, global warming observations can diverge from climate model projections of this warming. In addition to projecting warming of Earth's land surface air and oceans, climate models also project warming of the bulk troposphere, the atmospheric layer closest to the Earth's surface air [1; 8; 24]. In his Congressional testimony, the climate scientist John Christy depicted differences between observed tropospheric warming vs. modeled tropospheric warming [26, pages 2 - 4]. Figure 2 depicts this difference, as presented in one of Christy's graphs from his Congressional testimony:

Figure 2: Christy's comparison of the relative global mid-tropospheric temperature ("TMT") as projected by models versus as determined using observational analyses that rely on weather balloons and satellites [145, page 2]. Christy presents similar figures in other political testimony [26, page 3; 156, page 41]. Other sources offer comparisons less misleading than Christy's distorted graph [8, figure 1 on page 376; 9, figures 1a and 1b; 246; 333 - 335].
[The above graph is deeply flawed [246; 357], for reasons I go over in this blogpost and in "John Christy, Climate Models, and Long-term Tropospheric Warming". For example, the graph uses erroneous forcing estimates that exaggerate the model-based warming projections (especially during the post-1998 period), under-estimates observational uncertainty, does not correct for stratospheric cooling that contaminates the satellite-based estimates, under-estimates model uncertainty due to natural variability, and uses a very short baseline that exaggerates any differences between the model-based projections vs. the observational analyses.]
One could offer a number of different explanations for figure 2's discrepancy between model-based projections vs. observations. These climate science explanations parallel the coin flip explanations previously discussed:
- Explanation A1: Uncertainty or error in the observations, due to data correction for known errors (also known as homogenization) [8; 10; 11, 22; 32; 44 - 50; 66; 181], differences between the temperature trends produced by different research groups [1, page 478; 8, pages 374 and 379; 9; 10, page 3; 11; 12, page 24; 13, pages 2 - 4; 14; 15; 22; 32, table 4 on page 2285; 55; 67; 86; 114; 115], the 1998 transition in satellite equipment for monitoring atmospheric temperature [11, pages 69 and 72; 13, pages 2 and 3], changes in weather balloon equipment [68 - 70], etc. [141; 142; 197]. This may occur, for instance, when observational analyses are not of the same nature as model-based projections [197], as in the case of comparing sea surface warming analyses with model-based projections of near-surface air warming above the sea [22, section 2.3.2; 24; 114; 317, page 57; 318; 321, "Methods" section; 338 (with 337); 340]. These sources of observational uncertainty/error do not imply a flaw in the climate models [13, pages 3 and 4; 66; 96, pages 1706 and 1707; 124; 150, page 12].
- Explanation A2: Errors in measurements of human, solar, volcanic, and other factors [1, pages 478 and 483; 8, page 379; 12, page 27; 13, page 4; 14; 15; 66; 89; 103, as per 104; 113, box 9.2 on pages 769 - 772; 114; 314; 320; 338 (with 337); 340; 386; 425]. Estimates of these factors, or forcings, serve as input for the climate models, and the climate models then use this input (in addition to other information) to predict future trends under various scenarios. So errors in this model input could lead to incorrect model projections, even if the climate models themselves were perfect with respect to the physical processes relevant to climate change [13, page 4; 22, page 6; 51, page 2; 89, page 188; 96, pages 1706 and 1707; 124; 150, page 12].
- Explanation A3: Differences in natural or internal variability, affecting model uncertainty. Certain factors strongly influence shorter-term climate trends, while different factors more strongly influence longer-term climate trends [9; 10, page 3; 12, pages 16 and 27; 13, page 4; 15; 66; 90; 113, box 9.2 on pages 769 - 772; 125; 140; 144; 314; 338 (with 337); 423 - 425]. Shorter-term factors include aerosols and the El Niño phase of the El Niño-Southern Oscillation (ENSO) [1 page 478; 8, pages 379 - 381; 11, pages 70 and 72; 12, page 27; 13, pages 4 and 5; 16, page 194; 100; 101; 103, as per 104; 140; 144; 312]. ENSO-based variability in particular skews shorter-term model-based temperature projections beginning with a strong El Niño year like 1998 [8; 11; 13; 15; 16, page 194; 18 - 21; 23; 140, section 3; 144; 312]. Shorter-term temperature variability is also often due to the randomness / stochastic noise that afflicts smaller sample sizes. This randomness tends to have less of an effect on larger sample sizes [16, page 194; 17, figure 3; 140]. And a strong temperature response to transient, variable factors remains compatible with a strong temperature response to long-term increases in greenhouse gases such as carbon dioxide (CO2) [373 - 378; 423 - 425]. This shorter-term, natural variability can cause a discrepancy between observed short-term trends and model projections, even if the climate models themselves were perfect with respect to the physical processes relevant to climate change [13, page 4; 90; 96, pages 1706 and 1707; 124; 150, page 12].
- Explanation A4: Model error [56; 57; 103, as per 104; 112; 113, box 9.2 on pages 769 - 772; 198; 327; 421] due to, for example, the models being too sensitive to CO2 and thus over-estimating how much warming CO2 causes [8, page 379; 13, page 4; 14; 95, page 1551].
As in the case of the coin flip explanations, explanations A1 to A3 do not imply a flaw in the climate models, while only explanation A4 implies a flaw in the models.
Throughout this post, I will refer to these explanations simply as A1, A2, etc. or as:
- A1-observational-uncertainty
- A2-forcings-error
- A3-internal-variability
- A4-model-error
Explanations A1 to A4 are not mutually exclusive, so each explanation could contribute to explaining differences between observed warming vs model-projected warming [1, page 480; 8, page 379; 13, page 4; 22; 314].
Section 2.2: Errors in inputted forcings explain a large portion of difference between model-based projections vs. observational estimates of recent warming
Michael Mann and other climate scientists published research showing that A1-observational-uncertainty accounts for much of the difference between observed surface warming and climate model projections of this warming [18; 24; 35; 107 - 111; 114; 115; 125; 317, page 57; 318; 338 (with 337); 388 (blending effect on pages 9 - 10; figure S2B, with the temperature trend uncertainty range from figure 5A)]. Other scientists argued for a contribution from A2-forcings-error [22; 24; 33 - 35; 41; 89; 114; 179, figure 7; 320; 338 (with 337)] or A3-internal-variability [33 - 35; 40, with 379; 41; 144; 312; 338 (with 337); 423 - 425]. Once one includes post-2015 data to mitigate the effect of shorter-term internal variability, A1-observational-uncertainty sufficiently accounts for differences between model-based projections of surface warming trends vs. observational analyses [114; 317, page 57; 337 (with 338); 388 (blending effect on pages 9 - 10; figure S2B, with the temperature trend uncertainty range from figure 5A)]. Similarly, accounting for A2-forcings-error sufficiently accounts for the difference [22, figure 3; 35, figure 5; 179, figure 7]. Figure 3 below illustrates the effect of combining A1 and A2, along with their individual effect:

Figure 3: Comparison of near-surface temperature trend analyses with model-based projections, with or without correcting for errors in inputted forcings and for sea surface temperature trends vs. near-surface air trends above the sea. The temperature is relative to a baseline of 1981 - 2010.
The solid black line represents the average trend from climate models from the Coupled Model Intercomparison Project Phase 5 (CMIP-5). Pink shading encompasses 95% of the model-based projections and the dotted line encloses the most extreme/outlier projections.
The three observational analyses are from Berkeley Earth, Cowtan+Way's (CW) version of HadCRUT4, and NASA's GISTEMP. These observational analyses depict sea surface temperature trends, along with near-surface air temperature trends above land.
Blended TAS-TOS indicates model-based projection of temperature trends for the sea surface (i.e. for the water on the surface) and near-surface air above land. In contrast, Global TAS represents model-based projections of near-surface air above the sea and land, not the temperature of the sea surface water. Blended TAS-TOS, unlike Global TAS, is the appropriate metric for comparison to the model-based projections, since both Blended TAS-TOS and the observational analyses cover temperature trends for the sea surface and near-surface air above land [22, section 2.3.2].
S-adjusted [33; supported in 179, figure 7] and H-adjusted [34] are two different adjustments for errors in inputted forcings [22, section 2.3.1], using updated forcings.
As noted in the source for this figure, H-adjusted almost certainly over-estimates recent forcings [22, page 7], and thus provides a lower-bound for how much A2-forcings-error contributed to recent surface warming trends. So S-adjusted is more reliable than H-adjusted, and panel e shows the most appropriate comparison [22, figure 3].
Several other sources also discuss global TAS being greater than blended TAS-TOS [24; 114; 317, page 57; 318; 321, "Methods" section; 338 (with 337); 340], though one 2019 paper implicitly argues against this by stating that the post-1979 marine (sea) air warming trend is not higher than the sea surface warming trend [324, figures 12, 13, and table 1]. Another critic, Nic Lewis [381 - 383, in response to 384], claims that the TAS vs. TAS-TOS difference would only negligibly impact warming trends [381, section 3 on page 401; 382], and thus he would likely object to the above figure. But Lewis makes this claim by comparing TAS vs. TAS-TOS in observational analyses [381, section 3 on page 401], without adequately addressing the fact that the post-1979 model-based projected warming trend remains lower in TAS-TOS than in TAS, as per the figure above and numerous other sources [24; 114; 317, page 57; 318; 321, "Methods" section; 338 (with 337); 340]. Lewis also offers two other objections to the above figure and to A2-forcings-error: he appeals to the volcanic forcing results of H-adjusted [381, section 2 on page 401], and he states that [381, section 2 on page 401; 382] a 2015 paper from Outten et al. [40, with 379] shows that updated forcings do not reduce the model-based projected warming trend [381, section 2 on page 401; 382]. Both of Lewis' points fail. H-adjusted overestimates recent forcings [22, page 7; 33; 179, figure 7], even with volcanic forcing taken into account [22, page 7; 33; 179, figure 7; 385 (used in 321, via 373)]. Moreover, Outten et al. examines one climate model and remains fairly tentative in its results [40, section 6 (with 379)]. It was subsequently superseded by multiple other studies that examined more models and drew stronger conclusions in favor of A2-forcings-error [22; 35; 114; 179, figure 7; 338 (with 337)]. Interestingly, Lewis advocates A4-model-error in the form of models over-estimating climate sensitivity [381 - 383, in response to 384], while citing Outten et al., a paper that defends A3-internal-variability and objects to A2-forcings-error, without advocating A4-model-error [40, section 6 (with 379)]. Lewis' A4-model-error explanation would fail even if without the above defense of A2-forcings-error, since A1-observational-uncertainty on its own would sufficiently account for the differences between model-based projected trends vs. observational analyses [114; 317, page 57; 337 (with 338); 388 (blending effect on pages 9 - 10; figure S2B, with the temperature trend uncertainty range from figure 5A)]. For a further rebuttal to Lewis' defense of low climate sensitivity estimates, see sections 2.5 and 2.7 of "Myth: Attributing Warming to CO2 Involves the Fallaciously Inferring Causation from a Mere Correlation".
The observational analyses depicted in this figure may over-estimate 1940s - 1970s cooling due to uncertainties tied to changes in temperature monitoring practices during World War II [200 - 203], as I discuss in "Myth: Karl et al. of the NOAA Misleadingly Altered Ocean Temperature Records to Increase Global Warming", and depict in section 2.10 of "Myth: Attributing Warming to CO2 Involves the Fallaciously Inferring Causation from a Mere Correlation".
These explanations are also relevant to tropospheric warming, since surface warming often rises to the bulk troposphere, especially in the tropics [8, page 27; 9, section 1; 36, page 4; 37 - 39; 55]. Christy focuses on this region because he claims A4-model-error causes climate models to greatly over-estimate tropical tropospheric warming [26, page 4; 156, pages 39 - 45; 91, figure 3; 102, section 3.5; 131; 186; 195] (see "Myth: The Tropospheric Hot Spot does not Exist" for more on this). To illustrate this point, suppose an observational analysis showed a tropical surface warming trend 0.20 K per decade, and a mid-to-upper tropical tropospheric warming trend of 0.24 K per decade. Also suppose that two models have the following model-based warming projections in K per decade:
- Model 1 : 0.25 for surface, 0.30 for mid-to-upper troposphere
- Model 2 : 0.25 for surface, 0.45 for mid-to-upper troposphere
Model 1 has a mid-to-upper tropospheric vs. surface warming ratio of 1.2-to-1, consistent with the observational analysis. In contrast, model 2 has a larger ratio of 1.8-to-1. Both models project more surface warming than the observational analysis; suppose this is completely due to errors in inputted forcings, as per explanation A2. Correcting for these errors results in the following projections for the models, while maintaining each model's ratio of mid-to-upper tropospheric vs. surface warming:
- Model 1 : 0.20 for surface, 0.24 for mid-to-upper troposphere
- Model 2 : 0.20 for surface, 0.36 for mid-to-upper troposphere
Thus accounting for A2-forcings-error brought the warming projections for both models more in line with the observational analysis. Yet model 2 still projects more mid-to-upper tropospheric warming than the observational analysis, since model 2 has a larger ratio of mid-to-upper tropospheric vs. surface warming. Model 1 no longer projects more warming, since its ratio matches that of the observational analysis. So A2-forcings-error can play a relatively large role as an explanation when model-based warming ratios match those of observational analyses. Conversely, discrepancies in the ratio of tropospheric vs. surface warming argue against A2-forcings-error as the sole explanation for differences between models vs. observational analyses. The same point applies to A1-observational-uncertainty and A3-internal-variability .
The aforementioned explanation, however, does not extend to Christy's version of A4-model error. For example, in 2008 John Christy said the following with respect to a (debunked [96; 133; 139, from 31:13 to 42:40 {explained at a layman's level in GavinCawley's comments: 146; 147}; 196]) 2007 paper he co-authored [132] on model-projected tropical tropospheric warming vs. observational analyses:
"In other words we asked a very simple question, “If models had the same tropical SURFACE trend as is observed, then how would the UPPER AIR model trends compare with observations?” As it turned out, models show a very robust, repeatable temperature profile … that is significantly different from observations [131]."
Christy's critique of the models lacks merit [96; 133; 139, from 31:13 to 42:40 {explained at a layman's level in GavinCawley's comments: 146; 147}; 196]. For instance, he co-authored a 2018 paper showing that model-based projections and updated weather balloon (radiosonde) analyses displayed about the same ratio of tropical upper tropospheric warming to tropical near-surface warming [102, figure 18].
(This 2018 paper suffers from serious flaws that I discuss in section 2.2 of "Myth: Evidence Supports Curry's Claims Regarding Satellite-based Analyses and the Hot Spot", along with a separate multi-tweet Twitter thread [119].)
Another recent paper argued that once sea surface warming is accounted for, a particular climate model (the Whole Atmosphere Community Climate Model, a.k.a. WACCM) performed fairly well in representing tropospheric warming [79]. Five other papers supported a similar conclusion with respect to other climate models and tropical upper tropospheric warming [92; 93, figure 1; 116, sections 4 and 5; 138; 151, figure 3], while three other papers used indirect tests to confirm a similar conclusion [153 - 155]. Two other papers [8, figure 9 and page 384; 57] also showed that models performed fairly well with respect to the ratio of tropical upper tropospheric warming to lower tropical tropospheric warming.
Consistent with these results, two other papers argued that climate models accurately represent the ratio of surface warming to mid-to-upper tropospheric warming in the tropics, based on two other satellite-based analyses from teams at the University of Washington (UW) and the National Oceanic and Atmospheric Administration Center for Satellite Applications and Research (NOAA/STAR) [32; 198, figures 2a and 2b]. The most recent satellite-based analysis from Remote Sensing Systems (RSS) [85] supports the same conclusion, by showing mid-to-upper tropical tropospheric warming on par with the NOAA/STAR analysis [8; 79; 198]. Thus, given the models' accurate ratio of tropospheric warming to surface warming, climate models represent tropospheric warming better, once surface warming is accounted for using explanations A2-forcings-error, A1-observational-uncertainty, and A3-internal-variability.
Figure 4 below illustrates this point. This figure takes each model's ratio of pre-1978 tropical sea surface relative temperature values vs. tropical mid-to-upper tropospheric relative temperature values, and then applies that ratio to observed post-1979 sea surface relative temperature values. From this, figure 4 generates the model's predicted amount of tropical mid-to-upper tropospheric warming trend, based on observed sea surface warming trends [198, sections 2 and 3]. That predicted amount of warming better agrees with the warming from satellite-based observational analyses, removing most of the difference between the model-based projections vs. the observational analyses [198, figures 3a and 3b]:

Figure 4: Comparison of 1979 - 2018 tropical, mid-to-upper tropospheric relative temperature and trends from satellite-based observational analyses, vs. projections by climate models from the Coupled Model Intercomparison Project Phase 5 (CMIP-5), with or without ratio-adjusted prediction."Predicted" trends are generated by taking the ratio of a model's 1850 - 1978 detrended mid-to-upper tropospheric warming values vs. the model's de-trended precipitation-weighted sea surface temperature values, fitting that ratio to post-1979 sea surface warming and precipitation data from HadISST and Global Precipitation Climatology Project, and then using that fit to generate a post-1979 mid-to-upper tropospheric warming trend. The tropical latitudes used are 30°N to 30°S [198, sections 2 and 3]. The stratospheric-cooling-corrected satellite-based analyses in this figure come from Remote Sensing Systems (RSS4), the National Oceanic and Atmospheric Administration Center for Satellite Applications and Research (STR4), the University of Alabama in Huntsville (UAH6), and the University of Washington (UW).
(a) Shading for the model-based lines represents the 95% confidence interval. (b) The histograms on the left axis represent the probability that a model-based trend will have that corresponding warming trend [198, figure 3a and 3b].
One can compare figure 4's predicted, model-based tropical tropospheric warming trend to the tropical mid-to-upper tropospheric (TTT) warming trend from various observational analyses in the right-most column of figure 5 below, though figure 5 covers the tropical latitudes of 20°N to 20°S, while figure 4 covers the tropical latitudes of 30°N to 30°S:

Figure 5: Comparison of relative, lower and mid-to-upper tropospheric temperature trends (LTT and TTT, respectively) from 1958 - 2018 or 1979 - 2018 for weather-balloon-based analyses, satellite-based analyses, and re-analyses. The tropical latitudes used are 20°N to 20°S.
NASA/MERRA-2 begins in 1980. The data processing for UAH LTT is slightly different from the other analyses, causing its global trend value to be typically cooler by 0.01°C/decade in comparison to the other LTT trends [206, page S18]. ERA5 is an update to ERA-I [206, pages S18 - S19; 207 - 209; 243]; ERA-I under-estimates middle and lower tropospheric warming, as admitted by the ERA-I team [17, section 9; 138] and other researchers [210, section 2].
The radiosonde-based analyses in this figure come from the National Oceanic and Atmospheric Administration's Radiosonde Atmospheric Temperature Products for Assessing Climate (NOAA/RATPACvA2), Radiosonde Observation Correction using Reanalysis (RAOBCOREv1.7), and Radiosonde Innovation Composite Homogenization (RICH). The stratospheric-cooling-corrected satellite-based analyses in this figure come from Remote Sensing Systems (RSSv4.0), the University of Alabama in Huntsville (UAHv6.0), the National Oceanic and Atmospheric Administration Center for Satellite Applications and Research (NOAA/STARv4.1), and the University of Washington (UWv1.0). The re-analyses are the European Centre for Medium-Range Weather Forecasts Interim re-analysis (ERA-I) and re-analysis 5 (ERA5), the Japan Meteorological Agency 55-year Re-analysis (JRA-55), and the National Aeronautics and Space Administration's Modern-Era Retrospective analysis for Research and Applications (NASA/MERRA-2) [206, page S18].
A recent satellite-based global positioning system radio occultation (GPS RO; differs from the microwave-emissions-based satellite analyses in the figure above) paper showed that ERA-I, ERA5, and NASA/MERRA-2 under-estimate mid-to-upper tropospheric warming in comparison to 2002 - 2017 GPS RO results [209, figures 11 and 12].
Despite co-authoring the above figure [206, page S17], less than four months before the figure was published, Christy still falsely claimed to non-experts that the weather-balloon-based analyses supported his UAHv6.0 analysis over RSSv4.0 and UWv1.0 [244]. Christy tries to justify this by shifting [245] to his discussion of re-analyses from a March 2018 paper [102]. But as the above figure shows, the re-analyses still undermine Christy's low UAH warming trend, and his shift to re-analyses tacitly retracts his previous claim that weather-balloon-based analyses support his position [102; 244]. I critique Christy's March 2018 paper [102] in a parenthetical comment in section 2.2 of "Evidence Supports Curry's Claim Regarding Satellite-based Analyses".
Figure 5's median, tropical mid-to-upper tropospheric warming trend of 0.15 +/- 0.03°C/decade [206, page S18] overlaps with the predicted model-based range from figure 4. This despite the fact that figure 4's value is dragged down by analyses that likely under-estimate warming, such as Christy's UAHv6.0 [117], as I discuss in section 2.3. So figures 4 and 5, along with another paper from the climate scientist Ben Santer [8, page 379], undermine John Christy's claim that model-based tropical tropospheric warming trends remain three [145, page 13] or four [8, page 879; 26, page 4] times as large as values from observational analyses. Yet, ironically, Christy co-authored figure 5 [206, page S17], the figure which undermines his position.
And as the source for figure 4 notes:
"This suggests that overestimated [tropical mid-to-upper tropospheric] trends are mainly the result of the overestimation by models of tropical [sea surface temperature] trends in regions of deep convection [198]."
That point, combined with the fact that at least six other papers showed a large role for A2-forcings-error in explaining differences between surface warming analyses vs. model-based projections [22; 24; 33 - 35; 179, figure 7; 320; 338 (with 337)] (ex: see S-adjusted and H-adjusted in figure 3 above), suggests that A2-forcings-error also plays a large role in accounting for differences with respect to tropical tropospheric warming [332]. Consistent with this, the source for figure 4 notes previous research on contributions from A2-forcings-error [198, sections 1 and 4], including two papers co-authored by Ben Santer on the influence of A2-forcings-error on model-based projections of tropospheric warming trends [1; 89]. I discuss those two papers more in section 2.4.
Section 2.3: Scientists correct Christy and Cruz's distortions of of model-based trends vs. observational analyses
And now we reach one of the central questions relevant to the myth:
Q1: How much do explanations A1 to A4 contribute to explaining Christy's model-observations discrepancy from figure 2?
Section 2.2 addressed Q1 as follows: A2-forcings-error [22, figure 3; 35, figure 5; 179, figure 7] and/or A1-observational-uncertainty [114; 317, page 57; 337 (with 338); 388 (blending effect on pages 9 - 10; figure S2B, with the temperature trend uncertainty range from figure 5A)] adequately account for differences in global surface warming trends for model-based projections vs. observational analyses. Surface trends relate to bulk tropospheric trends because, for instance, surface warming rises to the bulk troposphere (especially in the tropics) [8, page 27; 9, section 1; 36, page 4; 37 - 39; 55] and factors such as greenhouse gas increases cause both surface warming and tropospheric warming. Climate models accurately represent the ratio of surface warming vs. tropospheric warming [32; 79; 92; 93, figure 1; 116, sections 4 and 5; 138; 151, figure 3; 198, figures 3a and 3b] for satellite-based analyses [32; 79; 198, figures 3a and 3b] and radiosonde-based analyses [92; 116, sections 4 and 5; 151, figure 3]. So since A2-forcings-error [22; 24; 33 - 35; 41; 89; 114; 179, figure 7; 320; 338 (with 337)] and A1-observational-uncertainty [18; 24; 35; 107 - 111; 114; 115; 125; 317, page 57; 318; 338 (with 337); 388 (blending effect on pages 9 - 10; figure S2B, with the temperature trend uncertainty range from figure 5A)] account for model-observations discrepancies in surface trends, they thereby help account for discrepancies in bulk tropospheric trends, given the relationship between surface trends vs. tropospheric trends.
One can add to this analysis by examining the data-sets in question. Let's start with the radiosonde trends. Christy implied that A4-model-error explains the discrepancy between radiosonde analyses vs. model-based projections [8, page 379; 26, pages 3 and 4]. But Christy's conclusion was premature. For years scientists have known that radiosonde analyses contain spurious cooling in the tropical troposphere [9; 11; 12, page 19; 32; 58; 59; 68 - 70; 94, pages 74 and 121; 121; 122; 387, from 19:42 to 24:00], as pointed out in a report that Christy co-authored [10, pages 3 and 7; 94, pages 74 and 121]. Christy commented on this cold bias before [60; 102, section 3.5; 120], so he has excuse for not being aware of it.
Christy should be aware of this cooling for another reason: over a decade ago, Christy emphasized how radiosonde analyses fit with Christy's small tropospheric warming trend from his work at the University of Alabama in Huntsville (UAH) [61; 63; 78; 88]. However, researchers at RSS then showed Christy that his tropospheric warming trend was spuriously low and needed to be adjusted upwards [62; 63; 181]; I discuss this more later in this section. Thus Christy should aware of the dangers on relying on spuriously cool, radiosonde-based trends. Yet in figure 2 Christy made the same error over a decade later. Christy continues to exploit this spurious cooling in order to exaggerate the difference between models vs. radiosonde analyses [64; 65].
The spuriously cool radiosonde trends likely resulted from changes in radiosonde equipment during the 1980s [68 - 70; 94, pages 74 and 121; 121; 122]. Including pre-1979 radiosonde data dilutes the effect of these 1980s change, and thus greatly reduces the difference between radiosonde trends vs. model-based projections for tropical tropospheric warming [9, figure 2; 66]. Accounting for the spurious post-1979 cooling (part of A1-observational-uncertainty), along with A3-internal-variability [9; 90; 143, slide 30; 423 - 425] and A2-forcings-error, explains most of the difference between models vs. radiosonde analyses with respect to the amount of tropical tropospheric warming; I discuss further in section 2.4. Similar explanations likely account for model-data differences outside of the tropics, though the differences are more pronounced in the tropics [68 - 70; 94, pages 74 and 121]. So Christy was wrong when he prematurely accepted A4-model-error as an explanation. That addresses Q1 for the radiosonde analyses in figure 2. So what about the satellite-based analyses?
The climate scientist Ben Santer co-authored an unpublished document addressing the satellite-based portion of Q1. In this document, he cited evidence on explanations A1 to A4 [13, pages 3 - 5]. Let's call this unpublished document Santer et al. #1 [13]. Santer et al. #1 criticizes US Senator Ted Cruz for offering only explanation A4-model-error as an account of Christy's depicted differences between observed warming vs. modeled warming:
"[Senator Cruz argues that the] mismatch between modeled and observed tropospheric warming in the early 21st century has only one possible explanation – computer models are a factor of three too sensitive to human-caused changes in greenhouse gases (GHGs) [13, pages 1 and 2].
[...]
The hearing also failed to do justice to the complex issue of how to interpret differences between observed and model-simulated tropospheric warming over the last 18 years. Senator Cruz offered only one possible interpretation of these differences – the existence of large, fundamental errors in model physics [...]. In addition to this possibility, there are at least three other plausible explanations for the warming rate differences [...] [13, pages 3 and 4]."
These points from Santer et. al. #1 re-iterate similar points from other scientists [268; 269; 276], and which Santer made in two 2000 papers [95, page 1551; 149], a 2008 paper [96, pages 1706 and 1707], and 2014 paper [89, page 188]. Let's call these papers Santer et al. #2 (for the two 2000 papers) [95; 149], Santer et al. #3 [96], and Santer et al. #4 [89], respectively. Santer followed up Santer et al. #1, #2, #3, and #4 with a 2017 paper in which he again cited evidence on explanations A1 to A4 [8, page 379 and 380]. Let's call this paper Santer et al. #5 [8]. In Santer et al. #5, Santer and his co-authors show that satellite readings of tropospheric temperature were contaminated by satellite readings of cooling in the stratosphere, an atmospheric layer higher than the troposphere [8]. This contamination introduced spurious cooling into satellite-based mid-to-upper tropospheric temperature trends [8].
Scientists have known about this bogus cooling since at least 1997 [30; 80]. The cooling is accounted for by 4 of the 5 major research groups (including RSS) that generate satellite-based tropospheric temperature measurements [8; 30; 31, page 2; 32, table 4 on page 2285; 71 - 74; 79, section 4.1; 80; 97, page 2]. Only the UAH research team fails to adequately correct for this cooling, since they object [77; 98; 99, section 1] to the validated [75; 76; 129; 130] correction method used by three of the other research groups [1; 8; 23; 30; 31, page 2; 32, table 4 on page 2285; 71 - 76; 79, section 4.1; 129; 130]; I discuss this correction further in section 2.3 of "Myth: The Tropospheric Hot Spot does not Exist".
The UAH team member John Christy then cited satellite-based tropospheric temperature trends containing this bogus cooling [26, pages 2 - 4]; figure 2 above shows this spuriously cool, satellite-based temperature trend, as does figure 6A below. Christy then used this flawed trend to exaggerate the discrepancy between observed satellite-based tropospheric warming vs. model projections of this warming [26, pages 2 - 4]. And Christy finally implied that A4-model-error explains this exaggerated discrepancy [8, page 379; 26, pages 3 and 4]. He did this despite the fact that he and his UAH team know about the stratospheric contamination of this analysis [102, sections 1 and 3.5; 117, section 7a; 118; 123, page S18].
So as we just saw, Christy's stated model-observations discrepancy was largely due to A1-observational-uncertainty resulting from the spurious cooling in Christy's reported tropospheric warming trend [8]. The climate scientist Michael Mann called Christy out on this [156, page 103], when Christy presented a version of his stratospheric-cooling-contaminated figure 2 in his political testimony [156, page 41]. Santer et al. #5 corrects Christy's spuriously cooling trend, as shown in figure 6 below:
Section 2.1: Factors influencing model-based trends and observational analyses
Skip to section 2.2 after looking at figure 2, if you already understand how observational error / observational uncertainty, internal variability, and errors in inputted forcings can explain differences between model-based projections vs. observational analyses, without implying a flaw in the models. If you do not understand this, or if what I just said sounds like scientific gibberish to you, then section 2.1 is for you.
The following analogy may help in understanding this myth [415, pages 92 - 94; 416 - 418; 419, from 0:00 to 4:15]:
The following analogy may help in understanding this myth [415, pages 92 - 94; 416 - 418; 419, from 0:00 to 4:15]:
Suppose Harvey generates a model that predicts coin flips; if you input information into the model, then the model will predict the number of heads and tails you will get from your coin flips. You can input conditions such as how many times you flipped the coin, whether the coin is fair or slightly loaded on one side of the coin, etc.
So suppose Yomotsu tells Harvey that Yomotsu's coin is fair/unloaded and that Yomotsu flipped the coin 40 times. Harvey inputs this information into his model and then runs the model on his computer 10,000 times, generating an output of 10,000 individual model runs. A small number of these runs generate ratios such as "29 heads, 11 tails" or "15 heads, 25 tails". But the average of the model runs is "20 heads, 20 tails."
So suppose Yomotsu tells Harvey that Yomotsu's coin is fair/unloaded and that Yomotsu flipped the coin 40 times. Harvey inputs this information into his model and then runs the model on his computer 10,000 times, generating an output of 10,000 individual model runs. A small number of these runs generate ratios such as "29 heads, 11 tails" or "15 heads, 25 tails". But the average of the model runs is "20 heads, 20 tails."
Then Yomotsu claims he flipped his fair coin 40 times, and ended up with a ratio of 12 heads to 28 tails. This differs from the "20 heads, 20 tails" average for Harvey's model runs. There are multiple possible explanations for the discrepancy between Harvey's model average and Yomotsu's claims. These explanations include:
- Observational uncertainty: There is error or uncertainty with respect to Yomotsu's reported observations, and this error/uncertainty affects Harvey's comparison of his model's output with Yomotsu's reported observations. For instance, Yomotsu may have misremembered the number of heads and tails for his 40 coin flips. This explanation implies a flaw in Yomotsu's reported observations, but not necessarily a flaw in Harvey's model.
- Error in the inputs: This explanation implies an error in the information inputted into Harvey's model; this leads to the model generating incorrect output. So, for example, Yomotsu's coin may be loaded on one side and thus not fair, despite Yomotsu's claims to the contrary. If this loading was provided as input for Harvey's model, then his model could have generated a more accurate prediction. The error would then be with Yomotsu's inputted claims, not Harvey's model.
- Natural variability and/or model uncertainty: Yomotsu's results may be real, but due to chance. Chance does not mean magic or something unnatural, since one can (in principle) give a scientific explanation for why each flip came up the way it did. This explanation would include information about the motion of Yomotsu's hand during each flip, differences in air pressure as the coin moved through the air, etc. These natural phenomena underlie the natural variability that results in chance fluctuations in the ratio of heads-to-tails. Chance fluctuations will affect smaller sample sizes more than larger sample sizes; for instance, one is more likely to get (by chance) 3 heads with 5 flips of a fair coin vs. getting 30,000 heads in 50,000 flips of said coin, despite the fact that these are both 3-to-5 ratios. So unlikely results can occur by chance, especially in smaller sample sizes. Even Harvey's model output illustrates this point, since some of his 40-flip model runs produced unlikely results; this yields model uncertainty, where individual model runs can differ from the model average. Thus natural variability contributes to model uncertainty. Even accurate models can have this model uncertainty due to natural variability / chance. And both model uncertainty and natural variability can account for why Yomotsu's results differ from Harvey's model average, even if Harvey's model is correct.
- Model error: On this explanation, Yomotsu's results differ from Harvey's model average because of an error in Harvey's model. Harvey's model, for example, may contain inaccurate equations relating a coin's geometry to the coin's flight through the air during a coin flip.
(See the work of potholer54 / Peter Hadfield for a similar example. His example involves natural variability from daily or weekly weather, in the context of a projection of multi-month warming from mid-winter to mid-summer based on a model of Earth's axial tilt relative to the Sun [148, from 6:20 to 14:26].)
Note that the first three explanations explain Yomotsu's claims without implying a flaw in Harvey's model, while only the fourth explanation implies a flaw in Harvey's model. Furthermore, these explanations are not mutually exclusive, since these four explanations could all simultaneously contribute to the difference between Harvey's model average and Yomotsu's reported results.
Just as Yomotsu's claims diverged from Harvey's model-based projections, global warming observations can diverge from climate model projections of this warming. In addition to projecting warming of Earth's land surface air and oceans, climate models also project warming of the bulk troposphere, the atmospheric layer closest to the Earth's surface air [1; 8; 24]. In his Congressional testimony, the climate scientist John Christy depicted differences between observed tropospheric warming vs. modeled tropospheric warming [26, pages 2 - 4]. Figure 2 depicts this difference, as presented in one of Christy's graphs from his Congressional testimony:
[The above graph is deeply flawed [246; 357], for reasons I go over in this blogpost and in "John Christy, Climate Models, and Long-term Tropospheric Warming". For example, the graph uses erroneous forcing estimates that exaggerate the model-based warming projections (especially during the post-1998 period), under-estimates observational uncertainty, does not correct for stratospheric cooling that contaminates the satellite-based estimates, under-estimates model uncertainty due to natural variability, and uses a very short baseline that exaggerates any differences between the model-based projections vs. the observational analyses.]
One could offer a number of different explanations for figure 2's discrepancy between model-based projections vs. observations. These climate science explanations parallel the coin flip explanations previously discussed:
Note that the first three explanations explain Yomotsu's claims without implying a flaw in Harvey's model, while only the fourth explanation implies a flaw in Harvey's model. Furthermore, these explanations are not mutually exclusive, since these four explanations could all simultaneously contribute to the difference between Harvey's model average and Yomotsu's reported results.
Just as Yomotsu's claims diverged from Harvey's model-based projections, global warming observations can diverge from climate model projections of this warming. In addition to projecting warming of Earth's land surface air and oceans, climate models also project warming of the bulk troposphere, the atmospheric layer closest to the Earth's surface air [1; 8; 24]. In his Congressional testimony, the climate scientist John Christy depicted differences between observed tropospheric warming vs. modeled tropospheric warming [26, pages 2 - 4]. Figure 2 depicts this difference, as presented in one of Christy's graphs from his Congressional testimony:
 |
Figure 2: Christy's comparison of the relative global mid-tropospheric temperature ("TMT") as projected by models versus as determined using observational analyses that rely on weather balloons and satellites [145, page 2]. Christy presents similar figures in other political testimony [26, page 3; 156, page 41]. Other sources offer comparisons less misleading than Christy's distorted graph [8, figure 1 on page 376; 9, figures 1a and 1b; 246; 333 - 335]. |
[The above graph is deeply flawed [246; 357], for reasons I go over in this blogpost and in "John Christy, Climate Models, and Long-term Tropospheric Warming". For example, the graph uses erroneous forcing estimates that exaggerate the model-based warming projections (especially during the post-1998 period), under-estimates observational uncertainty, does not correct for stratospheric cooling that contaminates the satellite-based estimates, under-estimates model uncertainty due to natural variability, and uses a very short baseline that exaggerates any differences between the model-based projections vs. the observational analyses.]
One could offer a number of different explanations for figure 2's discrepancy between model-based projections vs. observations. These climate science explanations parallel the coin flip explanations previously discussed:
- Explanation A1: Uncertainty or error in the observations, due to data correction for known errors (also known as homogenization) [8; 10; 11, 22; 32; 44 - 50; 66; 181], differences between the temperature trends produced by different research groups [1, page 478; 8, pages 374 and 379; 9; 10, page 3; 11; 12, page 24; 13, pages 2 - 4; 14; 15; 22; 32, table 4 on page 2285; 55; 67; 86; 114; 115], the 1998 transition in satellite equipment for monitoring atmospheric temperature [11, pages 69 and 72; 13, pages 2 and 3], changes in weather balloon equipment [68 - 70], etc. [141; 142; 197]. This may occur, for instance, when observational analyses are not of the same nature as model-based projections [197], as in the case of comparing sea surface warming analyses with model-based projections of near-surface air warming above the sea [22, section 2.3.2; 24; 114; 317, page 57; 318; 321, "Methods" section; 338 (with 337); 340]. These sources of observational uncertainty/error do not imply a flaw in the climate models [13, pages 3 and 4; 66; 96, pages 1706 and 1707; 124; 150, page 12].
- Explanation A2: Errors in measurements of human, solar, volcanic, and other factors [1, pages 478 and 483; 8, page 379; 12, page 27; 13, page 4; 14; 15; 66; 89; 103, as per 104; 113, box 9.2 on pages 769 - 772; 114; 314; 320; 338 (with 337); 340; 386; 425]. Estimates of these factors, or forcings, serve as input for the climate models, and the climate models then use this input (in addition to other information) to predict future trends under various scenarios. So errors in this model input could lead to incorrect model projections, even if the climate models themselves were perfect with respect to the physical processes relevant to climate change [13, page 4; 22, page 6; 51, page 2; 89, page 188; 96, pages 1706 and 1707; 124; 150, page 12].
- Explanation A3: Differences in natural or internal variability, affecting model uncertainty. Certain factors strongly influence shorter-term climate trends, while different factors more strongly influence longer-term climate trends [9; 10, page 3; 12, pages 16 and 27; 13, page 4; 15; 66; 90; 113, box 9.2 on pages 769 - 772; 125; 140; 144; 314; 338 (with 337); 423 - 425]. Shorter-term factors include aerosols and the El Niño phase of the El Niño-Southern Oscillation (ENSO) [1 page 478; 8, pages 379 - 381; 11, pages 70 and 72; 12, page 27; 13, pages 4 and 5; 16, page 194; 100; 101; 103, as per 104; 140; 144; 312]. ENSO-based variability in particular skews shorter-term model-based temperature projections beginning with a strong El Niño year like 1998 [8; 11; 13; 15; 16, page 194; 18 - 21; 23; 140, section 3; 144; 312]. Shorter-term temperature variability is also often due to the randomness / stochastic noise that afflicts smaller sample sizes. This randomness tends to have less of an effect on larger sample sizes [16, page 194; 17, figure 3; 140]. And a strong temperature response to transient, variable factors remains compatible with a strong temperature response to long-term increases in greenhouse gases such as carbon dioxide (CO2) [373 - 378; 423 - 425]. This shorter-term, natural variability can cause a discrepancy between observed short-term trends and model projections, even if the climate models themselves were perfect with respect to the physical processes relevant to climate change [13, page 4; 90; 96, pages 1706 and 1707; 124; 150, page 12].
- Explanation A4: Model error [56; 57; 103, as per 104; 112; 113, box 9.2 on pages 769 - 772; 198; 327; 421] due to, for example, the models being too sensitive to CO2 and thus over-estimating how much warming CO2 causes [8, page 379; 13, page 4; 14; 95, page 1551].
As in the case of the coin flip explanations, explanations A1 to A3 do not imply a flaw in the climate models, while only explanation A4 implies a flaw in the models.
Throughout this post, I will refer to these explanations simply as A1, A2, etc. or as:
- A1-observational-uncertainty
- A2-forcings-error
- A3-internal-variability
- A4-model-error
Explanations A1 to A4 are not mutually exclusive, so each explanation could contribute to explaining differences between observed warming vs model-projected warming [1, page 480; 8, page 379; 13, page 4; 22; 314].
Michael Mann and other climate scientists published research showing that A1-observational-uncertainty accounts for much of the difference between observed surface warming and climate model projections of this warming [18; 24; 35; 107 - 111; 114; 115; 125; 317, page 57; 318; 338 (with 337); 388 (blending effect on pages 9 - 10; figure S2B, with the temperature trend uncertainty range from figure 5A)]. Other scientists argued for a contribution from A2-forcings-error [22; 24; 33 - 35; 41; 89; 114; 179, figure 7; 320; 338 (with 337)] or A3-internal-variability [33 - 35; 40, with 379; 41; 144; 312; 338 (with 337); 423 - 425]. Once one includes post-2015 data to mitigate the effect of shorter-term internal variability, A1-observational-uncertainty sufficiently accounts for differences between model-based projections of surface warming trends vs. observational analyses [114; 317, page 57; 337 (with 338); 388 (blending effect on pages 9 - 10; figure S2B, with the temperature trend uncertainty range from figure 5A)]. Similarly, accounting for A2-forcings-error sufficiently accounts for the difference [22, figure 3; 35, figure 5; 179, figure 7]. Figure 3 below illustrates the effect of combining A1 and A2, along with their individual effect:
|
Figure 3: Comparison of near-surface temperature trend analyses with model-based projections, with or without correcting for errors in inputted forcings and for sea surface temperature trends vs. near-surface air trends above the sea. The temperature is relative to a baseline of 1981 - 2010.
The solid black line represents the average trend from climate models from the Coupled Model Intercomparison Project Phase 5 (CMIP-5). Pink shading encompasses 95% of the model-based projections and the dotted line encloses the most extreme/outlier projections.
The three observational analyses are from Berkeley Earth, Cowtan+Way's (CW) version of HadCRUT4, and NASA's GISTEMP. These observational analyses depict sea surface temperature trends, along with near-surface air temperature trends above land.
Blended TAS-TOS indicates model-based projection of temperature trends for the sea surface (i.e. for the water on the surface) and near-surface air above land. In contrast, Global TAS represents model-based projections of near-surface air above the sea and land, not the temperature of the sea surface water. Blended TAS-TOS, unlike Global TAS, is the appropriate metric for comparison to the model-based projections, since both Blended TAS-TOS and the observational analyses cover temperature trends for the sea surface and near-surface air above land [22, section 2.3.2].
S-adjusted [33; supported in 179, figure 7] and H-adjusted [34] are two different adjustments for errors in inputted forcings [22, section 2.3.1], using updated forcings.
As noted in the source for this figure, H-adjusted almost certainly over-estimates recent forcings [22, page 7], and thus provides a lower-bound for how much A2-forcings-error contributed to recent surface warming trends. So S-adjusted is more reliable than H-adjusted, and panel e shows the most appropriate comparison [22, figure 3].
The observational analyses depicted in this figure may over-estimate 1940s - 1970s cooling due to uncertainties tied to changes in temperature monitoring practices during World War II [200 - 203], as I discuss in "Myth: Karl et al. of the NOAA Misleadingly Altered Ocean Temperature Records to Increase Global Warming", and depict in section 2.10 of "Myth: Attributing Warming to CO2 Involves the Fallaciously Inferring Causation from a Mere Correlation".
|
These explanations are also relevant to tropospheric warming, since surface warming often rises to the bulk troposphere, especially in the tropics [8, page 27; 9, section 1; 36, page 4; 37 - 39; 55]. Christy focuses on this region because he claims A4-model-error causes climate models to greatly over-estimate tropical tropospheric warming [26, page 4; 156, pages 39 - 45; 91, figure 3; 102, section 3.5; 131; 186; 195] (see "Myth: The Tropospheric Hot Spot does not Exist" for more on this). To illustrate this point, suppose an observational analysis showed a tropical surface warming trend 0.20 K per decade, and a mid-to-upper tropical tropospheric warming trend of 0.24 K per decade. Also suppose that two models have the following model-based warming projections in K per decade:
- Model 1 : 0.25 for surface, 0.30 for mid-to-upper troposphere
- Model 2 : 0.25 for surface, 0.45 for mid-to-upper troposphere
Model 1 has a mid-to-upper tropospheric vs. surface warming ratio of 1.2-to-1, consistent with the observational analysis. In contrast, model 2 has a larger ratio of 1.8-to-1. Both models project more surface warming than the observational analysis; suppose this is completely due to errors in inputted forcings, as per explanation A2. Correcting for these errors results in the following projections for the models, while maintaining each model's ratio of mid-to-upper tropospheric vs. surface warming:
- Model 1 : 0.20 for surface, 0.24 for mid-to-upper troposphere
- Model 2 : 0.20 for surface, 0.36 for mid-to-upper troposphere
"In other words we asked a very simple question, “If models had the same tropical SURFACE trend as is observed, then how would the UPPER AIR model trends compare with observations?” As it turned out, models show a very robust, repeatable temperature profile … that is significantly different from observations [131]."
Christy's critique of the models lacks merit [96; 133; 139, from 31:13 to 42:40 {explained at a layman's level in GavinCawley's comments: 146; 147}; 196]. For instance, he co-authored a 2018 paper showing that model-based projections and updated weather balloon (radiosonde) analyses displayed about the same ratio of tropical upper tropospheric warming to tropical near-surface warming [102, figure 18].
(This 2018 paper suffers from serious flaws that I discuss in section 2.2 of "Myth: Evidence Supports Curry's Claims Regarding Satellite-based Analyses and the Hot Spot", along with a separate multi-tweet Twitter thread [119].)
Another recent paper argued that once sea surface warming is accounted for, a particular climate model (the Whole Atmosphere Community Climate Model, a.k.a. WACCM) performed fairly well in representing tropospheric warming [79]. Five other papers supported a similar conclusion with respect to other climate models and tropical upper tropospheric warming [92; 93, figure 1; 116, sections 4 and 5; 138; 151, figure 3], while three other papers used indirect tests to confirm a similar conclusion [153 - 155]. Two other papers [8, figure 9 and page 384; 57] also showed that models performed fairly well with respect to the ratio of tropical upper tropospheric warming to lower tropical tropospheric warming.
Consistent with these results, two other papers argued that climate models accurately represent the ratio of surface warming to mid-to-upper tropospheric warming in the tropics, based on two other satellite-based analyses from teams at the University of Washington (UW) and the National Oceanic and Atmospheric Administration Center for Satellite Applications and Research (NOAA/STAR) [32; 198, figures 2a and 2b]. The most recent satellite-based analysis from Remote Sensing Systems (RSS) [85] supports the same conclusion, by showing mid-to-upper tropical tropospheric warming on par with the NOAA/STAR analysis [8; 79; 198]. Thus, given the models' accurate ratio of tropospheric warming to surface warming, climate models represent tropospheric warming better, once surface warming is accounted for using explanations A2-forcings-error, A1-observational-uncertainty, and A3-internal-variability.
Figure 4 below illustrates this point. This figure takes each model's ratio of pre-1978 tropical sea surface relative temperature values vs. tropical mid-to-upper tropospheric relative temperature values, and then applies that ratio to observed post-1979 sea surface relative temperature values. From this, figure 4 generates the model's predicted amount of tropical mid-to-upper tropospheric warming trend, based on observed sea surface warming trends [198, sections 2 and 3]. That predicted amount of warming better agrees with the warming from satellite-based observational analyses, removing most of the difference between the model-based projections vs. the observational analyses [198, figures 3a and 3b]:
 |
| Figure 4: Comparison of 1979 - 2018 tropical, mid-to-upper tropospheric relative temperature and trends from satellite-based observational analyses, vs. projections by climate models from the Coupled Model Intercomparison Project Phase 5 (CMIP-5), with or without ratio-adjusted prediction."Predicted" trends are generated by taking the ratio of a model's 1850 - 1978 detrended mid-to-upper tropospheric warming values vs. the model's de-trended precipitation-weighted sea surface temperature values, fitting that ratio to post-1979 sea surface warming and precipitation data from HadISST and Global Precipitation Climatology Project, and then using that fit to generate a post-1979 mid-to-upper tropospheric warming trend. The tropical latitudes used are 30°N to 30°S [198, sections 2 and 3]. The stratospheric-cooling-corrected satellite-based analyses in this figure come from Remote Sensing Systems (RSS4), the National Oceanic and Atmospheric Administration Center for Satellite Applications and Research (STR4), the University of Alabama in Huntsville (UAH6), and the University of Washington (UW). (a) Shading for the model-based lines represents the 95% confidence interval. (b) The histograms on the left axis represent the probability that a model-based trend will have that corresponding warming trend [198, figure 3a and 3b]. |
One can compare figure 4's predicted, model-based tropical tropospheric warming trend to the tropical mid-to-upper tropospheric (TTT) warming trend from various observational analyses in the right-most column of figure 5 below, though figure 5 covers the tropical latitudes of 20°N to 20°S, while figure 4 covers the tropical latitudes of 30°N to 30°S:
 |
Figure 5: Comparison of relative, lower and mid-to-upper tropospheric temperature trends (LTT and TTT, respectively) from 1958 - 2018 or 1979 - 2018 for weather-balloon-based analyses, satellite-based analyses, and re-analyses. The tropical latitudes used are 20°N to 20°S. NASA/MERRA-2 begins in 1980. The data processing for UAH LTT is slightly different from the other analyses, causing its global trend value to be typically cooler by 0.01°C/decade in comparison to the other LTT trends [206, page S18]. ERA5 is an update to ERA-I [206, pages S18 - S19; 207 - 209; 243]; ERA-I under-estimates middle and lower tropospheric warming, as admitted by the ERA-I team [17, section 9; 138] and other researchers [210, section 2]. The radiosonde-based analyses in this figure come from the National Oceanic and Atmospheric Administration's Radiosonde Atmospheric Temperature Products for Assessing Climate (NOAA/RATPACvA2), Radiosonde Observation Correction using Reanalysis (RAOBCOREv1.7), and Radiosonde Innovation Composite Homogenization (RICH). The stratospheric-cooling-corrected satellite-based analyses in this figure come from Remote Sensing Systems (RSSv4.0), the University of Alabama in Huntsville (UAHv6.0), the National Oceanic and Atmospheric Administration Center for Satellite Applications and Research (NOAA/STARv4.1), and the University of Washington (UWv1.0). The re-analyses are the European Centre for Medium-Range Weather Forecasts Interim re-analysis (ERA-I) and re-analysis 5 (ERA5), the Japan Meteorological Agency 55-year Re-analysis (JRA-55), and the National Aeronautics and Space Administration's Modern-Era Retrospective analysis for Research and Applications (NASA/MERRA-2) [206, page S18]. A recent satellite-based global positioning system radio occultation (GPS RO; differs from the microwave-emissions-based satellite analyses in the figure above) paper showed that ERA-I, ERA5, and NASA/MERRA-2 under-estimate mid-to-upper tropospheric warming in comparison to 2002 - 2017 GPS RO results [209, figures 11 and 12]. Despite co-authoring the above figure [206, page S17], less than four months before the figure was published, Christy still falsely claimed to non-experts that the weather-balloon-based analyses supported his UAHv6.0 analysis over RSSv4.0 and UWv1.0 [244]. Christy tries to justify this by shifting [245] to his discussion of re-analyses from a March 2018 paper [102]. But as the above figure shows, the re-analyses still undermine Christy's low UAH warming trend, and his shift to re-analyses tacitly retracts his previous claim that weather-balloon-based analyses support his position [102; 244]. I critique Christy's March 2018 paper [102] in a parenthetical comment in section 2.2 of "Evidence Supports Curry's Claim Regarding Satellite-based Analyses". |
And as the source for figure 4 notes:
"This suggests that overestimated [tropical mid-to-upper tropospheric] trends are mainly the result of the overestimation by models of tropical [sea surface temperature] trends in regions of deep convection [198]."
That point, combined with the fact that at least six other papers showed a large role for A2-forcings-error in explaining differences between surface warming analyses vs. model-based projections [22; 24; 33 - 35; 179, figure 7; 320; 338 (with 337)] (ex: see S-adjusted and H-adjusted in figure 3 above), suggests that A2-forcings-error also plays a large role in accounting for differences with respect to tropical tropospheric warming [332]. Consistent with this, the source for figure 4 notes previous research on contributions from A2-forcings-error [198, sections 1 and 4], including two papers co-authored by Ben Santer on the influence of A2-forcings-error on model-based projections of tropospheric warming trends [1; 89]. I discuss those two papers more in section 2.4.
And now we reach one of the central questions relevant to the myth:
Q1: How much do explanations A1 to A4 contribute to explaining Christy's model-observations discrepancy from figure 2?
Section 2.2 addressed Q1 as follows: A2-forcings-error [22, figure 3; 35, figure 5; 179, figure 7] and/or A1-observational-uncertainty [114; 317, page 57; 337 (with 338); 388 (blending effect on pages 9 - 10; figure S2B, with the temperature trend uncertainty range from figure 5A)] adequately account for differences in global surface warming trends for model-based projections vs. observational analyses. Surface trends relate to bulk tropospheric trends because, for instance, surface warming rises to the bulk troposphere (especially in the tropics) [8, page 27; 9, section 1; 36, page 4; 37 - 39; 55] and factors such as greenhouse gas increases cause both surface warming and tropospheric warming. Climate models accurately represent the ratio of surface warming vs. tropospheric warming [32; 79; 92; 93, figure 1; 116, sections 4 and 5; 138; 151, figure 3; 198, figures 3a and 3b] for satellite-based analyses [32; 79; 198, figures 3a and 3b] and radiosonde-based analyses [92; 116, sections 4 and 5; 151, figure 3]. So since A2-forcings-error [22; 24; 33 - 35; 41; 89; 114; 179, figure 7; 320; 338 (with 337)] and A1-observational-uncertainty [18; 24; 35; 107 - 111; 114; 115; 125; 317, page 57; 318; 338 (with 337); 388 (blending effect on pages 9 - 10; figure S2B, with the temperature trend uncertainty range from figure 5A)] account for model-observations discrepancies in surface trends, they thereby help account for discrepancies in bulk tropospheric trends, given the relationship between surface trends vs. tropospheric trends.
One can add to this analysis by examining the data-sets in question. Let's start with the radiosonde trends. Christy implied that A4-model-error explains the discrepancy between radiosonde analyses vs. model-based projections [8, page 379; 26, pages 3 and 4]. But Christy's conclusion was premature. For years scientists have known that radiosonde analyses contain spurious cooling in the tropical troposphere [9; 11; 12, page 19; 32; 58; 59; 68 - 70; 94, pages 74 and 121; 121; 122; 387, from 19:42 to 24:00], as pointed out in a report that Christy co-authored [10, pages 3 and 7; 94, pages 74 and 121]. Christy commented on this cold bias before [60; 102, section 3.5; 120], so he has excuse for not being aware of it.
Christy should be aware of this cooling for another reason: over a decade ago, Christy emphasized how radiosonde analyses fit with Christy's small tropospheric warming trend from his work at the University of Alabama in Huntsville (UAH) [61; 63; 78; 88]. However, researchers at RSS then showed Christy that his tropospheric warming trend was spuriously low and needed to be adjusted upwards [62; 63; 181]; I discuss this more later in this section. Thus Christy should aware of the dangers on relying on spuriously cool, radiosonde-based trends. Yet in figure 2 Christy made the same error over a decade later. Christy continues to exploit this spurious cooling in order to exaggerate the difference between models vs. radiosonde analyses [64; 65].
The spuriously cool radiosonde trends likely resulted from changes in radiosonde equipment during the 1980s [68 - 70; 94, pages 74 and 121; 121; 122]. Including pre-1979 radiosonde data dilutes the effect of these 1980s change, and thus greatly reduces the difference between radiosonde trends vs. model-based projections for tropical tropospheric warming [9, figure 2; 66]. Accounting for the spurious post-1979 cooling (part of A1-observational-uncertainty), along with A3-internal-variability [9; 90; 143, slide 30; 423 - 425] and A2-forcings-error, explains most of the difference between models vs. radiosonde analyses with respect to the amount of tropical tropospheric warming; I discuss further in section 2.4. Similar explanations likely account for model-data differences outside of the tropics, though the differences are more pronounced in the tropics [68 - 70; 94, pages 74 and 121]. So Christy was wrong when he prematurely accepted A4-model-error as an explanation. That addresses Q1 for the radiosonde analyses in figure 2. So what about the satellite-based analyses?
The climate scientist Ben Santer co-authored an unpublished document addressing the satellite-based portion of Q1. In this document, he cited evidence on explanations A1 to A4 [13, pages 3 - 5]. Let's call this unpublished document Santer et al. #1 [13]. Santer et al. #1 criticizes US Senator Ted Cruz for offering only explanation A4-model-error as an account of Christy's depicted differences between observed warming vs. modeled warming:
"[Senator Cruz argues that the] mismatch between modeled and observed tropospheric warming in the early 21st century has only one possible explanation – computer models are a factor of three too sensitive to human-caused changes in greenhouse gases (GHGs) [13, pages 1 and 2].
[...]
The hearing also failed to do justice to the complex issue of how to interpret differences between observed and model-simulated tropospheric warming over the last 18 years. Senator Cruz offered only one possible interpretation of these differences – the existence of large, fundamental errors in model physics [...]. In addition to this possibility, there are at least three other plausible explanations for the warming rate differences [...] [13, pages 3 and 4]."
These points from Santer et. al. #1 re-iterate similar points from other scientists [268; 269; 276], and which Santer made in two 2000 papers [95, page 1551; 149], a 2008 paper [96, pages 1706 and 1707], and 2014 paper [89, page 188]. Let's call these papers Santer et al. #2 (for the two 2000 papers) [95; 149], Santer et al. #3 [96], and Santer et al. #4 [89], respectively. Santer followed up Santer et al. #1, #2, #3, and #4 with a 2017 paper in which he again cited evidence on explanations A1 to A4 [8, page 379 and 380]. Let's call this paper Santer et al. #5 [8]. In Santer et al. #5, Santer and his co-authors show that satellite readings of tropospheric temperature were contaminated by satellite readings of cooling in the stratosphere, an atmospheric layer higher than the troposphere [8]. This contamination introduced spurious cooling into satellite-based mid-to-upper tropospheric temperature trends [8].
Scientists have known about this bogus cooling since at least 1997 [30; 80]. The cooling is accounted for by 4 of the 5 major research groups (including RSS) that generate satellite-based tropospheric temperature measurements [8; 30; 31, page 2; 32, table 4 on page 2285; 71 - 74; 79, section 4.1; 80; 97, page 2]. Only the UAH research team fails to adequately correct for this cooling, since they object [77; 98; 99, section 1] to the validated [75; 76; 129; 130] correction method used by three of the other research groups [1; 8; 23; 30; 31, page 2; 32, table 4 on page 2285; 71 - 76; 79, section 4.1; 129; 130]; I discuss this correction further in section 2.3 of "Myth: The Tropospheric Hot Spot does not Exist".
The UAH team member John Christy then cited satellite-based tropospheric temperature trends containing this bogus cooling [26, pages 2 - 4]; figure 2 above shows this spuriously cool, satellite-based temperature trend, as does figure 6A below. Christy then used this flawed trend to exaggerate the discrepancy between observed satellite-based tropospheric warming vs. model projections of this warming [26, pages 2 - 4]. And Christy finally implied that A4-model-error explains this exaggerated discrepancy [8, page 379; 26, pages 3 and 4]. He did this despite the fact that he and his UAH team know about the stratospheric contamination of this analysis [102, sections 1 and 3.5; 117, section 7a; 118; 123, page S18].
So as we just saw, Christy's stated model-observations discrepancy was largely due to A1-observational-uncertainty resulting from the spurious cooling in Christy's reported tropospheric warming trend [8]. The climate scientist Michael Mann called Christy out on this [156, page 103], when Christy presented a version of his stratospheric-cooling-contaminated figure 2 in his political testimony [156, page 41]. Santer et al. #5 corrects Christy's spuriously cooling trend, as shown in figure 6 below:
 |
Figure 6: (A),(B) 1979 - 2016 near-global mid-to-upper tropospheric warming trends predicted by climate models from the Coupled Model Intercomparison Project Phase 5 (CMIP-5) and observed in satellite data analyses from the University of Alabama in Huntsville (UAH), Remote Sensing Systems (RSS), and the National Oceanic and Atmospheric Administration Center for Satellite Applications and Research (NOAA/STAR). Trends are presented as an average of all the trend values for a given trend length. Trends are not corrected for stratospheric cooling (A) or corrected for stratospheric cooling (B). (C),(D) Ratio between the tropospheric warming trend predicted by the climate models vs. the tropospheric warming trend observed in the satellite data analyses. The gray lines in (C) and (D) show the ratios Christy reported to Congress [26, page 3]. Trend ratios are not corrected for stratospheric cooling (C) or corrected for stratospheric cooling (D) [8, figure 2 on page 377]. |
Santer et al. #5 applies this stratospheric cooling correction to Christy's flawed analysis from figure 2 above, while also more accurately representing model uncertainty from A3-internal-variability. This correction allows for a more accurate comparison between the observations and the model-based projections, as shown in figure 7:
 |
| Figure 7: 1979 - 2016 near-global, mid-to-upper tropospheric relative temperature projected by climate models from the Coupled Model Intercomparison Project Phase 5 (CMIP-5), and observed in satellite data analyses. The temperature is relative to a baseline of January 1979 to December 2015. The pink line is the observed tropospheric warming trend, corrected for stratospheric cooling and shown as an average of analyses from the University of Alabama in Huntsville, Remote Sensing Systems, and the National Oceanic and Atmospheric Administration Center for Satellite Applications and Research satellite data analyses. The black line shows the average warming trend from an ensemble of climate models, while the gray region shows the range of values taken by different realizations of each model; different realizations have slightly different internal/natural variability [8, figure 1 on page 376]. |
Figure 7 incorporates data from the UAH analysis co-authored by Christy. But the UAH team's mid-to-upper tropospheric warming trend remains much lower than the warming trends from RSS and from a research team at the National Oceanic and Atmospheric Administration Center for Satellite Applications and Research (NOAA/STAR). The UAH analysis is most likely the flawed analysis since:
- UAH has a long history of under-estimating tropospheric warming due to UAH's faulty homogenization [11; 59; 60; 62; 81; 82; 83, from 36:31 to 37:10; 84, pages 5 and 6; 126 - 128; 181; 387, from 15:23 to 24:00].
- Other scientists have critiqued UAH's homogenization methods [12, pages 17 - 19; 30; 32; 47; 48; 60; 72; 81; 82; 85; 86; 126 - 128; 181; 387, from 15:23 to 24:00; 422].
- UAH's satellite-based temperature analyses often diverge from analyses made by other research groups, in both the troposphere and other atmospheric layers [12, pages 17 - 19; 30; 32; 47; 48; 72; 81; 85; 87; 123, pages S17 and S18; 126 - 130; 206, pages S17 and S18; also see: 365 and 380 (with 366 - 372, generated using 348, as per 349); 387, from 15:23 to 24:00].
These points support Santer et al. #5's contention that residual errors in the UAH analysis cause the analysis to under-estimate tropospheric warming [8, page 384]. Since figure 7 incorporates the UAH analysis' spuriously low warming trend, figure 7 likely under-estimates mid-to-upper tropospheric warming. Thus A1-observational-uncertainty would account for some of the residual model-observations discrepancy in figure 7.
In addition to defending A1-observational-uncertainty, Santer et al. #5 also rejects Christy's leap to A4-model-error [8, page 379], as do other scientists [268; 269; 276]:
"It is incorrect to assert that a large model error in the climate sensitivity to greenhouse gases is the only or most plausible explanation for differences in simulated and observed warming rates (Christy 2015) [8, page 379]."
By 2015, Christy had no excuse for leaping to A4-model-error and evading A1-observational-uncertainty. After all, explanation A1 debunked a number of his past claims regarding observational analyses. For example, in the 1990s Christy used his UAH analysis to falsely claim that the troposphere had not warmed. Other research teams corrected Christy's erroneous claim. These research teams showed that Christy's UAH analysis did not contain homogenization for known artifacts/errors in the data [11; 59; 62; 82; 83, from 36:31 to 37:10; 84, pages 5 and 6; 126 - 128; 137] (I discuss homogenization in more detail in section 3.1 of "John Christy, Climate Models, and Long-term Tropospheric Warming", with examples of scientists validating homogenization techniques [8; 32; 134]).
Two important examples of homogenization are a correction for satellites decaying in their orbits, and a diurnal drift correction to account for the fact that satellite measurements occur at different times of day [32; 60; 62; 85; 134 - 136; 181]. Since temperature at noon will likely be warmer than temperature at midnight, correcting for this time-of-day effect remains crucial for discovering any underlying tropospheric warming trends. Even when UAH began using these corrections (after other researchers showed UAH previously failed to apply these corrections [60; 137; 181]), the RSS team revealed that UAH bungled the diurnal drift homogenization in a way that spuriously reduced UAH's tropospheric warming trend [60; 62; 181]. According to UAH team members Spencer and Christy, correcting the UAH team's error increased UAH's lower tropospheric warming trend by ~40% [60]. RSS' own warming trend was even larger than this [62].
The UAH team's error occurred because the UAH team falsely assumed that the lower troposphere warmed at midnight and cooled at mid-day [60]. When Christy admitted this error, RSS members Carl Mears and Frank Wentz offered the following priceless reply [60; 205] (highlighting added):

Or as reportedly noted by Kevin Trenberth, one of Christy's supervisors in graduate school:
(This quote is consistent with Trenberth's decades-long history of documenting Christy's distortions and correcting those who abused Christy's distortions in order to misleadingly minimize global warming [80; 81; 351 - 353])
Yes, one wonders why the UAH team adopted an obviously wrong adjustment that conveniently reduced their stated amount of lower tropospheric warming. Maybe because it made it easier for UAH team member John Christy to claim that models were wrong, as per A4-model-error? In any event, this episode shows how A1-observationaluncertainty arising from UAH's flawed data analysis explained the difference between model-projected tropospheric warming vs. the lack of tropospheric warming in the UAH analysis [11; 59; 62; 82; 83, from 36:31 to 37:10; 84, pages 5 and 6; 126 - 128; 137; 181].
Similarly, UAH's flawed data analysis (A1-observational-uncertainty) likely explains why the UAH analysis does not show tropical amplified upper tropospheric warming, while this amplified warming appears in model-based projections and most other up-to-date observational analyses, as I discuss in "Myth: The Tropospheric Hot Spot does not Exist". So the models repeatedly made correct predictions that conflicted with Christy's incorrect observational analysis. This constitutes striking support for the models, illustrating how strong the models are [83, from 33:33 to 38:23; 313, pages 9 - 10]. For instance, suppose Carl claimed to grow complex bacteria overnight using just sterile broth. This conflicts with Louis Pasteur's well-supported theory of biogenesis, in which complex life only comes from other life. Now suppose scientists later discover that Carl's broth was contaminated with bacteria before-hand, and thus was not sterile, contrary to what Carl claimed and just as biogenesis theory predicted. This predictive power shows the strength of biogenesis theory, just as climate models showed predictive power by continually turning out to be right in the face of Christy's false claims.
In "John Christy and Atmospheric Temperature Trends", I summarize other instances in which Christy (unintentionally and/or intentionally) distorted observational analyses in a way that invented or exaggerated discrepancies between the analyses vs. model-based projections, as per A1-observational-uncertainty. So Christy should take A1-observational-uncertainty more seriously, since A1 keeps contributing to the discrepancies he discusses between models vs. observational analyses. Christy is also aware of A2-forcings-error [91, page 517; 195, page 8] and A3-internal-variability [91, page 517; 137]; he admits he cannot fully discount these explanations [91, page 517]. But Christy continues to leap to A4-model-error as an explanation anyway [8, page 379; 91, pages 515 - 517; 102, section 5; 156, page 43; 195, page 8; 257, from 15:50 to 16:11, and 21:45 to 22:28; 279]. This makes it easier for him to argue against using climate models to support policies he dislikes, such as government regulation of CO2 emissions (I discuss this issue more in section 2.5 of "Myth: The Sun Caused Recent Global Warming and the Tropical Stratosphere Warmed").
"[Trenberth] said he distanced himself from Christy around 2001, worried that every time a decision was called for in processing data, Christy was choosing values that gave little or no trend [339]."
(This quote is consistent with Trenberth's decades-long history of documenting Christy's distortions and correcting those who abused Christy's distortions in order to misleadingly minimize global warming [80; 81; 351 - 353])
Yes, one wonders why the UAH team adopted an obviously wrong adjustment that conveniently reduced their stated amount of lower tropospheric warming. Maybe because it made it easier for UAH team member John Christy to claim that models were wrong, as per A4-model-error? In any event, this episode shows how A1-observationaluncertainty arising from UAH's flawed data analysis explained the difference between model-projected tropospheric warming vs. the lack of tropospheric warming in the UAH analysis [11; 59; 62; 82; 83, from 36:31 to 37:10; 84, pages 5 and 6; 126 - 128; 137; 181].
Similarly, UAH's flawed data analysis (A1-observational-uncertainty) likely explains why the UAH analysis does not show tropical amplified upper tropospheric warming, while this amplified warming appears in model-based projections and most other up-to-date observational analyses, as I discuss in "Myth: The Tropospheric Hot Spot does not Exist". So the models repeatedly made correct predictions that conflicted with Christy's incorrect observational analysis. This constitutes striking support for the models, illustrating how strong the models are [83, from 33:33 to 38:23; 313, pages 9 - 10]. For instance, suppose Carl claimed to grow complex bacteria overnight using just sterile broth. This conflicts with Louis Pasteur's well-supported theory of biogenesis, in which complex life only comes from other life. Now suppose scientists later discover that Carl's broth was contaminated with bacteria before-hand, and thus was not sterile, contrary to what Carl claimed and just as biogenesis theory predicted. This predictive power shows the strength of biogenesis theory, just as climate models showed predictive power by continually turning out to be right in the face of Christy's false claims.
In "John Christy and Atmospheric Temperature Trends", I summarize other instances in which Christy (unintentionally and/or intentionally) distorted observational analyses in a way that invented or exaggerated discrepancies between the analyses vs. model-based projections, as per A1-observational-uncertainty. So Christy should take A1-observational-uncertainty more seriously, since A1 keeps contributing to the discrepancies he discusses between models vs. observational analyses. Christy is also aware of A2-forcings-error [91, page 517; 195, page 8] and A3-internal-variability [91, page 517; 137]; he admits he cannot fully discount these explanations [91, page 517]. But Christy continues to leap to A4-model-error as an explanation anyway [8, page 379; 91, pages 515 - 517; 102, section 5; 156, page 43; 195, page 8; 257, from 15:50 to 16:11, and 21:45 to 22:28; 279]. This makes it easier for him to argue against using climate models to support policies he dislikes, such as government regulation of CO2 emissions (I discuss this issue more in section 2.5 of "Myth: The Sun Caused Recent Global Warming and the Tropical Stratosphere Warmed").
Christy even acts as if "the scientific method" requires leaping to A4-model-error [156, page 43; 195, page 8; 257, from 21:45 to 22:28]. He is clearly wrong on this point; scientists should not simply leap to model error as an explanation [280; 281; 387, from 15:23 to 24:00]. For instance, when running an experiments, scientists often repeat the experiment, use a large sample size, run tests for statistical significance, etc., in order to account for internal/natural variability (A3) as an explanation. And the aforementioned bacteria example illustrates how experimental error (A1), instead of error in the biogenesis model (A4), explained a model vs. observational analyses discrepancy.
Similarly, when some scientific results suggested that small particles known as neutrinos could travel faster than light, in contradiction to modeled physics, scientists attempted to replicate the results. By doing this, they discovered that equipment error (A1), not A4-model-error, explained the initial results, and that the speed of neutrinos remained consistent with the speed of light [249 - 256]. Thus these scientists did not claim that the "scientific method" required leaping to model error as an explanation, contrary to Christy's ill-founded advice. Christy's own history of screw-ups also debunks his claims on the "scientific method", since, as discussed earlier in this section, in section 2.2, and in section 2.4, explanations such as A1-observational-uncertainty and A2-forcings-error often accounted for differences Christy pointed out.
Christy makes his "scientific method" point to Congress [156, page 43] and when writing in a politically-motivated think tank report targeted at the general public [195, page 8; 257, from 21:45 to 22:28]. But when writing in peer-reviewed work to informed scientists who are harder to fool, Christy admits he cannot fully discount the effects of A2-forcings-error and A3-internal-variability [91, page 517]. So he tells contradictory stories, depending on how difficult his audience is to mislead. Moreover, Christy presents no evidence rebutting explanations other than A4-model-error. Unlike Christy, Santer et al. #5 both pays sufficient attention to A1-observational-uncertainty and explains why Christy was wrong to leap to A4-model-error [8].
After rebutting Christy's position in Santer et al. #5 [8, page 379], Santer co-authored another 2017 paper with Michael Mann and other climate scientists. This paper further investigated explanations of the model-observations discrepancy in the troposphere [1]. Let's call this paper Santer et al. #6 [1]. Santer et al. #6 is the subject of our myth: myth proponents misrepresent Santer et al. #6.
Santer et al. #6 argues for A2-forcings-error [1, page 483], after accounting for the spurious stratospheric contamination (A1-observational-uncertainty) discussed in Santer et al. #5. Thus Santer et al. #6 builds [1, page 483] on Santer et al. #4's evidence in support of A2-forcings-error as a contributor to differences between model-based projections vs. satellite-based observational analyses of tropospheric warming [89].
This fits with the evidence discussed in section 2.2; namely: A2-forcings-error accounts for differences between observational analyses vs. model-based projections for surface warming [22; 24; 33 - 35; 41; 89; 114; 179, figure 7; 320; 338 (with 337)], and thus helps account for differences in the troposphere, since surface warming often rises to the bulk troposphere, especially in the tropics [8, page 27; 9, section 1; 36, page 4; 37 - 39; 55] (I discuss this further in "Myth: The Tropospheric Hot Spot does not Exist"). The errors in inputted forcings occurred primarily during the post-1998 period [22, section 2.3.1; 24; 33 - 35; 179, figure 7], which explains much of the post-1998 difference between observational analyses vs. model-based projections in figures 3a, 4a, 7, 8, and 9. Correcting these errors for bulk tropospheric analyses, as figure 3e does for near-surface analyses, would reduce this post-1998 difference. So the published evidence on surface trends indirectly supports Santer et al. #6's A2-forcings-error explanation of mid-to-upper tropospheric warming trends.
In contrast to Santer et al. #6's A2-forcings-error explanation [1], Christy's "oversensitive models" A4-model-error explanation [8, page 379; 91, pages 515 - 517; 102, section 5; 156, page 43; 195, page 8; 279] makes no physical sense. Christy's explanation requires that models over-estimate climate sensitivity, and thus over-estimate how much warming increased CO2 causes. Let's set aside the fact that multiple lines of scientific evidence rebut Christy's position by supporting higher estimates of climate sensitivity, including estimates higher than those from climate models [ex: 241; 242] (for more on this, see sections 2.5 and 2.7 of "Myth: Attributing Warming to CO2 Involves the Fallaciously Inferring Causation from a Mere Correlation").
Instead we can begin by noting that at least two types of factors influence climate sensitivity. Positive feedbacks amplify warming in response to warming, and thereby increase climate sensitivity. Negative feedbacks mitigate warming in response to warming, and therefore decrease climate sensitivity [211 - 214]. To give a rough analogy: one can think of positive feedbacks as accelerators of global warming, while negative feedbacks act as brakes. The enhanced bulk tropospheric warming Christy discusses would be a negative feedback known as the negative lapse rate feedback [37; 38; 198; 213; 214; 215, section 2.6.1 on page 90; 216 - 229; 235 - 237], as I discuss in section 2.1 of "Myth: No Hot Spot Implies Less Global Warming and Support for Lukewarmerism".
Instead we can begin by noting that at least two types of factors influence climate sensitivity. Positive feedbacks amplify warming in response to warming, and thereby increase climate sensitivity. Negative feedbacks mitigate warming in response to warming, and therefore decrease climate sensitivity [211 - 214]. To give a rough analogy: one can think of positive feedbacks as accelerators of global warming, while negative feedbacks act as brakes. The enhanced bulk tropospheric warming Christy discusses would be a negative feedback known as the negative lapse rate feedback [37; 38; 198; 213; 214; 215, section 2.6.1 on page 90; 216 - 229; 235 - 237], as I discuss in section 2.1 of "Myth: No Hot Spot Implies Less Global Warming and Support for Lukewarmerism".
The mechanism of this negative feedback is as follows, especially in the tropics over tropical oceans:
- Surface warming evaporates liquid water to form water vapor.
- This evaporation increases the amount of water vapor in the air, since warmer air can hold more water vapor.
- The warm, vapor-rich air rises higher into the troposphere by convection.
- Water vapor condenses with increasing tropospheric height, since tropospheric temperature and pressure decrease with increasing height.
- Condensation of water vapor releases some of the energy that went into evaporating the water. This condensation further warms the bulk troposphere [8; 36, page 4; 37 - 39; 83, from 31:01 to 31:48; 198; 230, pages 7 and 8; 217; 231, pages 101 and 102; 232, page 2048; 233].
- The warming troposphere more readily emits much of this energy away from Earth towards space, as per the Stefan-Boltzmann law [37; 198, section 1; 215; 217; 220; 226, section 2.6.1 on page 90; 234, figure 3c on page 5 and page 16; 235].
To borrow an analogy from the climate researcher Mark Richardson: this energy transfer is similar to sweating, in which sweat evaporates on a person's skin and then condenses elsewhere, cooling the skin and transferring body heat to the site of condensation [233, from 3:05 to 3:49]. The aforementioned negative lapse rate feedback similarly transfers energy from Earth's surface to higher in the troposphere, where that energy more easily radiates away. Christy admits that this response is supposed to act as a negative feedback, when he writes to informed scientists in the peer-reviewed literature and elsewhere [91, page 516; 186; 238]. But when he speaks to the general public, he misleads them into thinking this response represents the water vapor feedback [257, from 16:11 to 17:12].
But the water vapor feedback is not the same as the negative lapse rate feedback [215, section 2.6.1 on page 90; 216; 218; 220; 225; 226; 229; 235]; the former is a positive feedback resulting from accumulating water vapor absorbing radiation emitted by the Earth [27; 216; 226; 229; 235; 259 - 261], while the latter is a negative feedback resulting from condensing water vapor releasing heat [37; 38; 216; 217; 224; 226] and the upper troposphere then emitting much of this energy away from Earth [37; 198, section 1; 215, section 2.6.1 on page 90; 217; 220; 226; 234, figure 3c on page 5 and page 16; 235] (for more on this, see section 2.1 of "Myth: No Hot Spot Implies Less Global Warming and Support for Lukewarmerism" and section 2.1 of "Myth: Attributing Warming to CO2 Involves the Fallaciously Inferring Causation from a Mere Correlation"). There is evidence of a robust, positive water vapor feedback on multi-decadal time-scales, including in the bulk troposphere [223; 262 - 267; 272; 273], despite Christy's false claims to the contrary [238; 257, from 16:11 to 17:12]. Water vapor also condenses to form low altitude and high altitude clouds, resulting in a cloud feedback that is net positive [210; 218; 223; 282 - 294]. Christy knows the water vapor feedback is not the negative lapse rate feedback [238] from amplified, upper tropospheric warming, but he misleads the public about this anyway [257, from 16:11 to 17:12].
But the water vapor feedback is not the same as the negative lapse rate feedback [215, section 2.6.1 on page 90; 216; 218; 220; 225; 226; 229; 235]; the former is a positive feedback resulting from accumulating water vapor absorbing radiation emitted by the Earth [27; 216; 226; 229; 235; 259 - 261], while the latter is a negative feedback resulting from condensing water vapor releasing heat [37; 38; 216; 217; 224; 226] and the upper troposphere then emitting much of this energy away from Earth [37; 198, section 1; 215, section 2.6.1 on page 90; 217; 220; 226; 234, figure 3c on page 5 and page 16; 235] (for more on this, see section 2.1 of "Myth: No Hot Spot Implies Less Global Warming and Support for Lukewarmerism" and section 2.1 of "Myth: Attributing Warming to CO2 Involves the Fallaciously Inferring Causation from a Mere Correlation"). There is evidence of a robust, positive water vapor feedback on multi-decadal time-scales, including in the bulk troposphere [223; 262 - 267; 272; 273], despite Christy's false claims to the contrary [238; 257, from 16:11 to 17:12]. Water vapor also condenses to form low altitude and high altitude clouds, resulting in a cloud feedback that is net positive [210; 218; 223; 282 - 294]. Christy knows the water vapor feedback is not the negative lapse rate feedback [238] from amplified, upper tropospheric warming, but he misleads the public about this anyway [257, from 16:11 to 17:12].
So when Christy claims bulk tropospheric warming is muted, especially in the tropics [26, page 4; 156, pages 39 - 45; 91, figure 3; 102, section 3.5; 131; 186; 195], this implies a weaker negative feedback and thus greater climate sensitivity, or at the very least not decreased climate sensitivity. Yet Christy uses this muted tropospheric warming to claim decreased climate sensitivity [8, page 379; 91, pages 515 - 517; 102, section 5; 156, page 43; 195, page 8; 279]. Christy's position therefore conflicts with basic physics, as pointed out to him by Jos Hagelaars [277; 278], along with climate scientists such as Michael Mann [156, page 103], Steven Sherwood [239], and Chris Colose [240].
Christy attempts to shore up his position by claiming (without presenting any published evidence) that climate models under-estimate how much energy Earth releases into space as Earth warms, and thus models over-estimate the amount of energy Earth accumulates [257, from 16:18 to 17:13; 319]. Christy's claim fails since climate models do not substantially over-estimate the amount of energy accumulating in the deeper oceans [302 - 304; 320; 328; 329; 420], where >90% of the excess energy should go [295 - 301; 320; 330; 331; 363; 420] and where greenhouse gas increases also cause warming [297; 302; 304 - 311; 320; 325; 326; 328 - 331; 363; 420]. And models do fairly well in representing the net energy imbalance between how much energy Earth releases vs. how much energy it takes in [315; 316; 354; 356] (a recent 2020 paper [354; 355] remains particularly problematic for Christy's position [257, from 16:18 to 17:13; 319]). So Christy distorts energy accumulation within the climate system, along with distorting the role of the negative lapse rate feedback in Earth's release of energy.
To put this in terms of Richardson's analogy [233, from 3:05 to 3:49]: Christy's contrarian position is akin to arguing that stopping the effects of sweating will cause your body to not warm as much. Or to return to the brake and accelerator analogy: Christy's position is akin to misrepresenting a missing brake as being a missing accelerator, and arguing that lacking a brake would cause things to slow down. He needs to provide a physically-consistent model that explains the evidence, and accounts for why weakening a negative feedback would result in lower climate sensitivity, just as flat Earthers need to provide a physically-consistent model that explains multiple phenomena [358, from 1:08; 359]. Christy is not particularly credible when he offers his physically implausible explanation, especially given his decades-long history of (intentionally or unintentionally) incorrectly leaping to A4-model-error as an explanation, as discussed in section 2.3. In climate science, Christy is the boy who cries wolf over and over and over and...
Santer et al. #6 offers three further arguments [1, page 483] against Christy's [8, page 379; 91, pages 515 - 517; 102, section 5; 156, page 43; 195, page 8; 279] "oversensitive models" A4-model-error explaining most of the post-1998 model-observations tropospheric divergence:
- If the models are much too sensitive to CO2, then there should be a specific, large discrepancy between observed cooling in response to volcanic eruptions (after correcting for El Niño) vs. the models' predicted temperature trend response to said eruptions. But this large discrepancy does not appear [1, page 483], as shown in Santer et al. #4 [89].
- If the over-sensitivity accounts for most of the post-1998 model-observations discrepancy, then models should exaggerate pre-1999 CO2-induced warming as well. So there should be a similar pre-1999 model-observations discrepancy with respect to the rate of tropospheric warming. Yet this pre-1999 discrepancy is not evident [1, page 483, figure 1, and figure 2], as shown in figures 4a and 7 above, along with figures 8 and 9 below. Instead the discrepancy occurs post-1998, coinciding with errors in inputted forcings [1].
- The results of a statistical, model-based test using a proxy for each model's climate sensitivity argues against the model-sensitivity form of A4-model-error. But a combination of A2-forcings-error and A3-internal-variability plausibly explains the results of this test [1, page 483; 424, with 423 and 425].
Other published research supports their first point listed above on volcanic eruptions [179; 187, figure 3; 188 - 193; 364], though more recent research offers mixed results on this argument as applied to surface trends [34; 40; 179; 364; 408 - 411; 412 (with 413); 414]. Their second point is illustrated by figure 7 above from Santer et al. #5, figure 4a, figure 8 below from Santer et al. #6, and figure 9 below from another paper. The authors of figure 9 note that A4-model-error does not account for most of figure 9's remaining difference between model-based projections vs. weather-balloon-based tropical tropospheric warming trends. Instead the authors attribute the difference to A1-observational-uncertainty, A3-internal-variability, and period-dependent mechanisms that apply to the specific time period of the discrepancy, in contrast to a factor such as over-sensitive models A4-model-error, which would apply across all time periods [9, section 4]. A2-forcings-error is one such period-dependent mechanism, as per Santer et al. #6 [1]:
 |
| Figure 8: Comparison of 1979 - 2016 near-global, mid-to-upper tropospheric relative temperature projected by climate models from the Coupled Model Intercomparison Project Phase 5 (CMIP-5), vs. observational trends from the RSS satellite-based analysis. The temperature is relative to a baseline of January 1979 to December 2016. The green lines for "CHI" and "PIN" indicate the El Chichón and Pinatubo volcanic eruptions, respectively, which resulted in subsequent temporary cooling. The purple line represents the 1997/1998 El Niño that came with sharp, temporary warming. (a) Stratospheric-cooling-corrected warming trends for the RSS analysis and the corresponding average projected warming trend from the CMIP5 models. The straight pink line indicates the average linear warming trend for the RSS analysis. (b) Depiction of the RSS warming trend subtracted from the average projected CMIP5 warming trend [1, figure 1 on page 479]. |
 |
Figure 9: Comparison of 1958 - 2014 tropical, upper tropospheric relative temperature (TTT) from weather-balloon-based (radiosonde-based) observational analyses, vs. projections by climate models from the Coupled Model Intercomparison Project Phase 5 (CMIP-5) and the Max Planck Institute Earth System Model ensemble (MPI-ESM). "CIMP5" and "CMPI5" are mis-spellings; they should read "CMIP5". The solid colored line for each set of models represents the average model-based trend, while the dashed colored lines represent individual model runs. The dashed vertical lines represent major volcanic eruptions. The tropical latitudes used are 20°N to 20°S. The relative temperature is taken from an atmospheric pressure level of 300hPa, since this is where tropical tropospheric warming is largest in model-based projections and most radiosonde-based observational analyses. However, the general results of comparing model-based projections with observational analyses do not substantially differ at other mid-to-upper tropospheric pressure levels [9, section 2]. The radiosonde-based analyses in this figure come from Iterative Universal Kriging (IUKv2), Radiosonde Atmospheric Temperature Products for Assessing Climate (RATPAC), Hadley Center Radiosonde Temperature (HadAT2), Radiosonde Innovation Composite Homogenization (RICH), and Radiosonde Observation Correction using Reanalysis (RAOBCORE) [9, figures 1a and 1b]. |
One might object to Santer et al. #6's second point by claiming that the climate models were adjusted or tuned to match observational analyses of pre-1998 tropospheric warming. For the sake of argument, let's ignore the fact that many models [360, table 2 on page 3218, with 361; 362, pages 597 - 598] were not tuned to match surface warming, and instead grant Christy's claim [156, page 43; 186, page 530; 257, from 40:26 to 40:43] that models were tuned in this way. Since surface warming often rises to the bulk troposphere, especially in the tropics [8, page 27; 9, section 1; 36, page 4; 37 - 39; 55], Christy's claim of tuning of surface trends [156, page 43; 186, page 530; 257, from 40:26 to 40:43] would also imply tuning of bulk tropospheric trends (see section 2.2 and "Myth: The Tropospheric Hot Spot does not Exist" for more on this). Christy, however, states the models were not tuned to match observational analyses of tropospheric warming, especially the tropical tropospheric warming trends shown in figure 9 [186, page 531]. That therefore implicitly conflicts with his tuning objection.
Moreover, Christy states tuning undermines comparisons of model-based projections with surface warming analyses [156, page 43; 186, page 530; 257, from 40:26 to 40:43], even though he cites supposed differences between projections vs. surface warming analyses when he thinks he can use them to support his A4-model-error "oversensitive models" explanation [91, page 516; 279]. So Christy's stance on tuning conflicts with his exploitation of surface warming analyses, the tuning objection remains closed to Christy when it comes to tropospheric warming analyses, Christy's position again makes no physical sense, and the aforementioned second point still undermines Christy's position, as do the other two listed points from Santer et al. #6 and Santer et al. #4.
Thus Santer et al. #4 and Santer et al. #6 argue against the "oversensitive models" A4-model-error explanation from Christy's testimony to Congress, as noted in the following quote from Santer et al. #6:
The authors of Santer et al. #6 re-iterate this point in the fact sheet accompanying the paper:
"Question 4: Do the problems in representing these external cooling influences point to systematic errors in how sensitive the models are to human-caused greenhouse gas (GHG) increases?
Answer: No, not at all. We are talking about known, well-studied problems with some of the external, climate-influencing “forcing factors” that were used in the model simulations. These problems have nothing to do with the issue of how sensitive models are to GHG increases.
Question 5: Haven’t some scientists claimed that the larger-than-observed model warming in the early 21st century is solely due to over-sensitive models?
Answer: Yes, such claims have been made and continue to be made. We tested the “over-sensitive models” claim in our paper, and found that it does not explain the actual differences between modeled and observed tropospheric warming behavior. Nor does a combination of “over-sensitive models” and natural internal variability plausibly explain the differences [51, page 2]."
And in contrast to other researchers [22; 24; 33 - 35; 89; 179, figure 7; 320; 338 (with 337)], Christy did not use updated forcing estimates [91; 102], which conveniently allowed him to further exaggerate differences between model-based projections vs. observational analyses. Yet he still jumped to the "over-sensitive models" A4-model-error explanation anyway [91; 195, page 8], contrary to the rebuttal Santer gave in Santer et. al #6 [1, pages 482 and 483]. Christy exacerbated the issue by insinuating, without citing any evidence, that scientists disingenuously ignore model error in order to keep getting money [257, from 15:50 to 16:11, and 21:45 to 22:28]; this despite the fact that climate scientists seriously assessed his A4-model-error explanation, as the example of Santer et al. #6 shows [1, pages 482 - 483; 51, page 2]. So Christy added to his history of inventing debunked, paranoid conspiracy theories about the scientific community [133; 258]. Scientists take the time to assess Christy's proposals [1, pages 482 - 483; 51, page 2], while he fails to adequately address [91, page 517] their A2-forcings-error explanation.
This is not the first time Christy evaded issues with forcings, in order to falsely claim model-based projections were wrong. For example, in 2018 Christy argued in a non-peer-reviewed blog article [166] that the climate scientist James Hansen [167, figure 3 on page 9347; 168, figure 2 on page 14289; 169] over-estimated post-1988 surface warming in Hansen's 1988 model-based projections. Thus Christy claimed A4-model-error for Hansen's model [166]. He repeated his distortions of Hansen's model-based projections in another 2019 non-peer-reviewed article Christy wrote for a politically-motivated think tank [195, page 3]. Others also misrepresented the accuracy of Hansen's projections [395 (with 396); 397 (with 174; 398; 399; 400, from 11:51 to 17:55; 401, pages 9 - 11; 402; 403); 404 - 407].
But Christy's 2018 article conveniently side-stepped [166; 170; 171; 271] the fact that two of Hansen's projections [167, figure 2 on page 9345, and pages 9360 - 9362; 168, page 14289] over-estimated post-1988 forcings from factors such as non-CO2 greenhouse gases [170]. After all, Hansen was not psychic, and thus in 1988 could not know about the various factors that would affect greenhouse gas emissions, such as the collapse of the Soviet Union, the Montreal Protocol that limited the release of chlorofluorocarbons (CFCs) [123, page S19; 157 - 163; 164, pages 599 and 600; 165; 182 - 184; 185, figure 2], etc. Hence Hansen's 1988 paper providing multiple possible scenarios for projected post-1988 forcings [167, figure 3 on page 9347; 168, figure 2 on page 14289]. In contrast, Christy should be aware of these factors in 2018; for instance, Christy previously acknowledged the effect of the Montreal Protocol on atmospheric temperature trends [123, page S19].
When one accounts for the actual levels of greenhouses gases (and other factors) released, along with the forcing that results from these factors, Hansen's 1988 model-based projection does very well when compared to observational analyses of surface warming, as per A2-forcings-error and as noted in a number of non-peer-reviewed articles [172 - 178; 194; 322; 323; 333; 336] and a peer-reviewed paper [321]. The same point applies to the United Nations Intergovernmental Panel on Climate Change's (IPCC's) 1990 and 2007 model-based projections, as I discuss in "Myth: The IPCC's 1990 Report Over-estimated Greenhouse-gas-induced Global Warming" and section 2.1 of "Myth: The IPCC's 2007 ~0.2°C/decade Model-based Projection Failed and Judith Curry's Forecast was More Reliable", respectively. Christy's co-author Ross McKitrick [166] even admits to other scientists that it is valid to account for the forcing from actual greenhouse gas levels [270], though he and Christy still conveniently fail to do this when writing to the general public [166; 271]. Christy obscures this point in his non-peer-reviewed blog article by evading A2-forcings-error [166; 170; 171; 271], so he can again leap to A4-model-error as an explanation [166]. And he repeats this convenient oversight for tropospheric warming trends, as pointed out in Santer et al. #6 [1, pages 482 and 483].
(Ironically, Christy's own claims fared poorly in comparison to Hansen's. For instance, in the early 2000s, Christy used his UAH satellite-based analysis to falsely claim the troposphere was not warming, leaving it to other scientists to correct his falsehoods [11; 59; 62; 82; 83, from 36:31 to 37:10; 84, pages 5 and 6; 126 - 128; 137]. He also reportedly seemed at a loss for what he would do if the bulk troposphere warmed with the surface [43; 248], and he reportedly claimed that future warming was as likely as future cooling [43; 204]. In response, Hansen said the troposphere was warming, and would continue to warm [43; 389]. And, of course, Hansen was right, as shown by figure 5 above, the evidence of tropospheric warming shown in this blogpost [ex: 1; 8 - 11; 17; 30 - 32; 79; 97; 116; 123, page S17; 134; 136; 138], "Myth: No Global Warming for Two Decades", and the UAH analysis that Christy himself corrected [11; 60; 84; 117]. Yet almost two decades later, Christy still [166; 195, page 3] misrepresents Hansen's position to make it appear that Hansen was wrong. Others similarly misrepresented Hansen as supposedly predicting that Manhattan / New York City would be underwater by 2008 as a result of sea level rise from CO2-induced warming [390, with 391 and 392 (full Twitter threads for 390 and 391)]; 393; 394].)
Myth proponent Judith Curry is therefore wrong when she claims that Santer et al. #6 confirms what Christy and Cruz have been saying:
"The paper confirms what John Christy has been saying for the last decade, and also supports the ‘denier’ statements made by Ted Cruz about the hiatus [5]."
Curry's above "hiatus" statement [5] is a distortion, since Santer et al. #5 [8] and Santer et al. #6 [1, figure 1] rebut the idea of a "hiatus" by showing tropospheric warming over the past two decades (I discuss further evidence against this "hiatus" claim in "Myth: No Global Warming for Two Decades"). Curry evidently does not agree with Santer et al. #6's conclusion [5]. But instead of accurately reporting Santer et al. #6's claims and then stating why she disagrees with those claims (which would be a fine thing for Curry to do), Curry instead claims that Santer et al. #6 confirms a position that Santer et al. #6 actually argues against. Maue and Bastasch engage in a similar distortion when they say that Santer and Christy "seem to be on the same page [2; 3]." Thus Maue, Bastasch, and Curry employ a common tactic used by critics of mainstream science: they misrepresent sources [28; 29]. There is no excuse for their misrepresentations, especially since Santer made these points for at least 17 years, dating back to at least Santer et al. #2 in 2000 [95, page 1551].
Maue [2; 3], Bastasch [2; 3], and Lloyd [4] also use Santer et al. #6 to claim that climate models are flawed. But this too is a misrepresentation of Santer et al. #6, since Santer et al. #6 argues for A2-forcings-error [1] and this explanation does not imply a flaw in the climate models [13, page 4; 89, page 188; 96, pages 1706 and 1707; 124]. Santer et al. #6 would need to support the A4-model-error in order for Maue, Bastasch, and Lloyd to be right. Yet Santer et al. #6 argues against A4-model-error [1, pages 482 and 483]. So Maue, Bastasch, and Lloyd are again distorting the implications of Santer et al. #6.
Maue [2; 3], Bastasch [2; 3], and Lloyd [4] also use Santer et al. #6 to claim that climate models are flawed. But this too is a misrepresentation of Santer et al. #6, since Santer et al. #6 argues for A2-forcings-error [1] and this explanation does not imply a flaw in the climate models [13, page 4; 89, page 188; 96, pages 1706 and 1707; 124]. Santer et al. #6 would need to support the A4-model-error in order for Maue, Bastasch, and Lloyd to be right. Yet Santer et al. #6 argues against A4-model-error [1, pages 482 and 483]. So Maue, Bastasch, and Lloyd are again distorting the implications of Santer et al. #6.
Pielke Sr., another myth proponent, states that Santer et al. #6 shows that CO2 is not the primary controller of climate changes on multi-decadal time-scales [6] (in making this comment, Pielke may be throwing shade at an often-cited paper that called CO2 the primary control knob of long-term climate [27; 180]). Pielke's claim would make sense only if Santer et al. #6 supported the "oversensitive models" form of A4-model-error. But Santer et al. #6 instead argue against this explanation [1, pages 482 and 483]. Thus Pielke also misrepresents Santer et al. #6. This represents another instance of a pattern extending back at least a decade: Pielke distorts science, and Santer addresses the distortion [105]. Pielke has a long history of misrepresenting the accuracy of climate scientists' predictions [341; 342, figure 1; 343, generated using 348, as per 349; 344 - 347; 350]. And as we saw in section 2.3, Santer went through the same pattern with Christy as well. Some things never change.
So we can now take stock of some of the central points made in sections 2.1 to 2.4 of this blogpost. Points 1 to 3 below support Santer et al. #6's A2-forcings-error explanation, while points 2 to 7 undermine Christy's A4-model-error explanation in terms of models being too sensitive to increased CO2:
- A2-forcings-error accounts for discrepancies in surface temperature trends; this explanation also extends to the bulk troposphere, in large part due to surface warming rising to the bulk troposphere, especially in the tropics, and climate models accurately representing the ratio of surface warming vs. bulk tropospheric warming (section 2.2)
- discrepancies between model-based projections vs. observational analyses occur post-1998 instead of throughout the tropospheric temperature trend record, coinciding with errors in inputted forcings (section 2.4)
- a statistical, model-based test using a proxy of each model's sensitivity (section 2.4)
- models fairly accurate represent the temperature response to volcanic eruptions (section 2.4)
- mitigated bulk tropospheric warming relative to surface warming would point to increased sensitivity, not reduced sensitivity (section 2.4)
- Christy's decades-long history of prematurely leaping to A4-model-error as an explanation, when other explanations were instead correct (sections 2.3 and 2.4)
- estimates of sensitivity near or above those of climate models (sections 2.5 and 2.7 of "Myth: Attributing Warming to CO2 Involves the Fallaciously Inferring Causation from a Mere Correlation")
Unfortunately, many genuinely curious people will not read Santer et al. #6. Instead these people will trust the claims Pielke [6; 7], Curry [5], Maue [2; 3], etc. make about Santer's paper. After all, why would climate scientists (Pielke and Curry), a meteorologist (Maue), and press sources (Maue, Bastasch, and Lloyd) blatantly misrepresent a scientific paper to an inquiring public? I am not going to answer that question now, but I have my suspicions on what the right answer is. All I will note here is that these myth proponents misrepresented Santer's paper, as other's have noted before me [42]. There is no need to trust these myth proponents, when the authors of Santer et al. #6 have offered a non-technical fact sheet summarizing the main points of Santer et al. #6 [51]. The website CarbonBrief also offers an informative, laymen's level summary of Santer et al. #6 [199].
So where does this topic go from here? Genuinely curious people can keep at an eye out for at least three things:
- Feel free to check the peer-reviewed scientific literature regularly, to see if climate scientists incorporated the updated forcings into model-based tropospheric warming projections. These temperature projections would come from the Coupled Model Intercomparison Project Phase 5 (CMIP-5) model ensemble discussed by Santer in Santer et. al #4 [89], Santer et al. #5 [8], and Santer et al. #6 [1]. I think this incorporation will likely occur, since scientists previously updated the forcings for model-based surface warming projections [22; 24; 33 - 35; 179, figure 7; 320; 338 (with 337)] and tropospheric warming projections [89].
- At the 2017 European Geosciences Union (EGU) General Assembly, a scientist submitted a poster abstract comparing satellite-based tropospheric warming trends with model-based projections that use observed forcings [52]. This abstract uses the Whole Atmosphere Community Climate Model (WACCM) for its comparison [52]. Another abstract [53] from the same poster session [54] compared weather-balloon-based tropical tropospheric warming trends with model-based warming projections.This weather-balloon-based abstract used the CMIP5 model ensemble and the Max Planck Institute Earth System model (MPI-ESM) ensemble; the abstract then formed the basis of a peer-reviewed paper published earlier this year [9]. So, hopefully, the satellite-based WACCM abstract will also lead to a peer-reviewed publication in the near future. Feel free to keep an eye out for that satellite-based paper (added note: the paper was subsequently published on September 25, 2017 [79]).
- At the December 2018 American Geosciences Union (AGU) Fall 2018 meeting, a member of NOAA satellite-based team submitted an abstract comparing satellite-based tropospheric warming trends with model-based projections. This abstract argues for the error in inputted forcings explanation [152], in accordance with Santer et al. #6 [1].
Christy also recently co-authored three papers again emphasizing comparisons of models and climate data [91; 102; 186]. I address his 2017 paper on lower tropospheric temperature trends [91] in my blogpost "John Christy Fails to Show that Climate Models Exaggerate CO2-induced Warming". And I briefly cover his March 2018 paper [102] on mid-to-upper tropospheric temperature trends [102] in section 2.2 of "Myth: Evidence Supports Curry's Claims Regarding Satellite-based Analyses and the Hot Spot", along with a separate multi-tweet Twitter thread [119]. All three papers [91; 102; 186] commit the erroneous leap to A4-model-error that I critiqued in this blogpost.
3. Posts Providing Further Information and Analysis
- Sections 3.3, 3.4, and 3.6 of "John Christy, Climate Models, and Long-term Tropospheric Warming"
- Sections 3.4 of part 1 of "Christopher Monckton and Projection Future Global Warming"
- Sections 3.3, 3.4, and 3.6 of "John Christy, Climate Models, and Long-term Tropospheric Warming"
- Sections 3.4 of part 1 of "Christopher Monckton and Projection Future Global Warming"
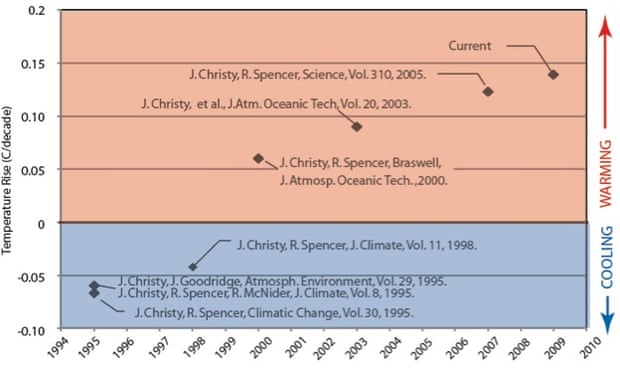
hey, there is a broken link in this article, under the anchor text - Climate change 2013: The physical science basis; Chapter 9: Evaluation of climate models
ReplyDeleteHere is the working link so you can replace it - https://selectra.co.uk/sites/selectra.co.uk/files/pdf/Climate%20models.pdf
Thanks
Delete