- The Myth and Its Flaw
- Context and Analysis
- Posts Providing Further Information and Analysis
- References
This is the "+References" version of this post, which means that this post contains my full list of references and citations. If you would like an abbreviated and easier to read version, then please go to the "main version" of this post.
References are cited as follows: "[#]", with "#" corresponding to the reference number given in the References section at the end of this post.
1. The Myth and Its Flaw
The myth states that there has been, or would be, no warming over or within the past two decades.
Purveyors of this myth include Christopher Monckton [1, pages 122 and 127; 2, pages 1379, 1385, and 1387], Willie Soon [1, pages 122 and 127; 2, pages 1379, 1385, and 1387], David Legates [1, pages 122 and 127; 2, pages 1379, 1385, and 1387], John Christy [3; 4], Ted Cruz [5, page 1], Scott Pruitt [25; 100, page 145], James Delingpole [112; 113], Peter Ferrara [127], Clive Best [196; 341], Dennis Avery [132], David Archibald [94; 95, figure 30 on page 21], Anthony Watts [6; 44], Patrick Michaels [7, page 5 and chapter 13; 155], Paul (Chip) Knappenberger [7, page 5 and chapter 13], Fritz Vahrenholt [147], Sebastian Lüning [133; 147], Judith Curry [40; 44; 120; 149, citing 150; 221; 222; 234; 235] (Curry also predicts no near-future warming for decades [106 - 109; 120; 221; 222; 234]), DocMartyn on Judith Curry's blog [148], David J. Pristash of the Principia Scientific International blog [188], Bob Tisdale [44], William Gray [202, figure 14 on page 13; 203; 204], Don Easterbrook [94; 96; 97; 101, pages 1 and 2; 197, figure 24 on page 456; 239], Habibullo Abdussamatov [121, figure 3; 122; 233], Nils-Axel Mörner [139, section 2.2], François Gervais [194], Joachim Seifert [183, pages 2, figure 2, and figure A4], Frank Lemke [183, pages 2, figure 2, and figure A4], Girma Orssengo [128, figure 3], Carl-Otto Weiss [123, from 14:37 to 18:52; 124, figure 3], Dietrich Koelle [125], Herbert Grubel [87], Pat Frank [218; 219], Ira Glickstein [104; 105], Leonid B. Klyashtorin [159, figure 5; 220], Alexey A. Lyubushin [159, figure 5; 220], Yanjun Mao [192, figure 2; 193], Jiqing Tan [192, figure 2; 193], Bomin Chen [192, figure 2; 193], Huiyi Fan [192, figure 2; 193], Cliff Ollier [131], Scott Armstrong [114 - 119], Richard Lindzen [41, page 421; 86, page 7; 136], Sherwood Idso [276, citing 277; 278, citing 279], Ole Humlum [189, section 4] (who runs the contrarian blog Climate4You [190]), Jan-Erik Solheim [189, section 4], Kjell Stordahl [189, section 4], Nicola Scafetta [90, figure 12; 91, figure 16; 92, figure 6; 111, figure 5; 154, page 74 and figure 5 on page 82; 268], Craig Loehle [154, page 74 and figure 5 on page 82; 158, figure 6; 268], Syun-Ichi Akasofu [89, figure 5; 273] (some of Akasofu's own defenders admit he under-estimated warming [256, citing 257 - 259, for 260; similar point in: 261 - 263; 287]), Norman J. Page [201, figure 12 on page 14; 211], Qing-Bin Lu [140, figure 12 on page 7; 141; addressed in: 142 - 146], Matt Ridley [48], Ian Plimer [94; 102; 103], Thayer Watkins [205 - 207], Alan Rudge [102; 103], Anastasios Tsonis [42, page 4; 43; 129; 130; 162, paragraphs 14 and 15; 241; 242, 342], Joseph D'Aleo [197, figure 24 on page 456; 198 - 200], Dan Pangburn [269; 270; 271 (with 283 - 286)], Warren Meyer [274], and Joe Bastardi [98; 99] (Bastardi claims a decade of cooling for 2011 - 2021 [98; 99], and thus his claim is not yet falsified, though post-2011 trends so far suggest his claim will likely fail, as shown in section 2). I discuss some of these myth proponents' debunked temperature trend predictions in a separate multi-tweet Twitter thread [93], with a separate thread that also rebuts Curry's claims [134].
(All of these myth proponents also run afoul of the quantified post-1997 and post-1998 surface warming trends in section 2.1 of "Myth: The IPCC's 2007 ~0.2°C/decade Model-based Projection Failed and Judith Curry's Forecast was More Reliable").
The following blogposts and Twitter threads provide numerous examples of temperature trend predictions, including false predictions of no global warming:
- https://twitter.com/AtomsksSanakan/status/1066223748037128192
- https://twitter.com/AtomsksSanakan/status/1074861836086992896
- sections 1 and 2.1 of "Myth: The IPCC's 2007 ~0.2°C/decade Model-based Projection Failed and Judith Curry's Forecast was More Reliable"
- sections 1 and 2.1 of "Myth: The IPCC's 1990 Report Over-estimated Greenhouse-gas-induced Global Warming"
- section 2.5 and 2.10 of "Myth: Attributing Warming to CO2 Involves the Fallaciously Inferring Causation from a Mere Correlation"
The myth's flaw: over the past two decades, the near-surface air above ocean and land warmed [8 - 24; 35 - 39; 45 - 47; 51 - 56; 58; 65, page S12; 81; 82; 85; 126, figure 1A; 135; 156; 157; 164; 215; 223; 224; 227; 229, figure 1; 237; 244, figures 7 and 8; 247; 249; 264; 272], as has the lower atmosphere [3; 8; 25 - 28; 29, figure 3; 34; 63, figure 4; 65, page S17]. Other indirect measures [72; 216, from 6:10 to 7:36; 266], such as melting ice [72; 165 - 170; 180; 181; 184 - 187; 195; 208; 232; 240; 272; 275; 282] sea level rise acceleration [65, page S85; 72; 171 - 181; 184; 191, figure 3 on page 8; 213; 238; 248; 267], increasing geopotential height due to thermal expansion of the lower atmosphere [288 - 290, made using 49, as per 50 (with 291 - 293 and 336 - 338)], and increases in temperature extremes [65, page S17; 209; 210; 213], indicated warming as well. This warming was reflected in the difference between the amount of energy Earth takes up vs. the amount of energy Earth release, as indicated by continued warming of deeper ocean regions [17; 22; 30; 31; 32, figure 3; 57; 62; 64; 65, page S76; 138; 152; 153; 160; 212; 217; 243; 254; 255; 272; 280]. Ocean warming is the main metric of note, since ~90% of the excess energy goes into warming the oceans [17; 22; 32; 62; 72; 138; 160; 243; 254; 255; 280].
One should expect future contrarians/denialists to continue abusing anomalously warm years in order to avoid acknowledging the magnitude of human-made global warming. Take the example of as ocean cycle known as the El Niño Southern Oscillation (ENSO), with its warm El Niño phase and cool La Niña phase [3; 246]. Future contrarians/denialism will likely continue doing at least one of the following:
The myth states that there has been, or would be, no warming over or within the past two decades.
Purveyors of this myth include Christopher Monckton [1, pages 122 and 127; 2, pages 1379, 1385, and 1387], Willie Soon [1, pages 122 and 127; 2, pages 1379, 1385, and 1387], David Legates [1, pages 122 and 127; 2, pages 1379, 1385, and 1387], John Christy [3; 4], Ted Cruz [5, page 1], Scott Pruitt [25; 100, page 145], James Delingpole [112; 113], Peter Ferrara [127], Clive Best [196; 341], Dennis Avery [132], David Archibald [94; 95, figure 30 on page 21], Anthony Watts [6; 44], Patrick Michaels [7, page 5 and chapter 13; 155], Paul (Chip) Knappenberger [7, page 5 and chapter 13], Fritz Vahrenholt [147], Sebastian Lüning [133; 147], Judith Curry [40; 44; 120; 149, citing 150; 221; 222; 234; 235] (Curry also predicts no near-future warming for decades [106 - 109; 120; 221; 222; 234]), DocMartyn on Judith Curry's blog [148], David J. Pristash of the Principia Scientific International blog [188], Bob Tisdale [44], William Gray [202, figure 14 on page 13; 203; 204], Don Easterbrook [94; 96; 97; 101, pages 1 and 2; 197, figure 24 on page 456; 239], Habibullo Abdussamatov [121, figure 3; 122; 233], Nils-Axel Mörner [139, section 2.2], François Gervais [194], Joachim Seifert [183, pages 2, figure 2, and figure A4], Frank Lemke [183, pages 2, figure 2, and figure A4], Girma Orssengo [128, figure 3], Carl-Otto Weiss [123, from 14:37 to 18:52; 124, figure 3], Dietrich Koelle [125], Herbert Grubel [87], Pat Frank [218; 219], Ira Glickstein [104; 105], Leonid B. Klyashtorin [159, figure 5; 220], Alexey A. Lyubushin [159, figure 5; 220], Yanjun Mao [192, figure 2; 193], Jiqing Tan [192, figure 2; 193], Bomin Chen [192, figure 2; 193], Huiyi Fan [192, figure 2; 193], Cliff Ollier [131], Scott Armstrong [114 - 119], Richard Lindzen [41, page 421; 86, page 7; 136], Sherwood Idso [276, citing 277; 278, citing 279], Ole Humlum [189, section 4] (who runs the contrarian blog Climate4You [190]), Jan-Erik Solheim [189, section 4], Kjell Stordahl [189, section 4], Nicola Scafetta [90, figure 12; 91, figure 16; 92, figure 6; 111, figure 5; 154, page 74 and figure 5 on page 82; 268], Craig Loehle [154, page 74 and figure 5 on page 82; 158, figure 6; 268], Syun-Ichi Akasofu [89, figure 5; 273] (some of Akasofu's own defenders admit he under-estimated warming [256, citing 257 - 259, for 260; similar point in: 261 - 263; 287]), Norman J. Page [201, figure 12 on page 14; 211], Qing-Bin Lu [140, figure 12 on page 7; 141; addressed in: 142 - 146], Matt Ridley [48], Ian Plimer [94; 102; 103], Thayer Watkins [205 - 207], Alan Rudge [102; 103], Anastasios Tsonis [42, page 4; 43; 129; 130; 162, paragraphs 14 and 15; 241; 242, 342], Joseph D'Aleo [197, figure 24 on page 456; 198 - 200], Dan Pangburn [269; 270; 271 (with 283 - 286)], Warren Meyer [274], and Joe Bastardi [98; 99] (Bastardi claims a decade of cooling for 2011 - 2021 [98; 99], and thus his claim is not yet falsified, though post-2011 trends so far suggest his claim will likely fail, as shown in section 2). I discuss some of these myth proponents' debunked temperature trend predictions in a separate multi-tweet Twitter thread [93], with a separate thread that also rebuts Curry's claims [134].
- https://twitter.com/AtomsksSanakan/status/1066223748037128192
- https://twitter.com/AtomsksSanakan/status/1074861836086992896
- sections 1 and 2.1 of "Myth: The IPCC's 2007 ~0.2°C/decade Model-based Projection Failed and Judith Curry's Forecast was More Reliable"
- sections 1 and 2.1 of "Myth: The IPCC's 1990 Report Over-estimated Greenhouse-gas-induced Global Warming"
- section 2.5 and 2.10 of "Myth: Attributing Warming to CO2 Involves the Fallaciously Inferring Causation from a Mere Correlation"
The myth's flaw: over the past two decades, the near-surface air above ocean and land warmed [8 - 24; 35 - 39; 45 - 47; 51 - 56; 58; 65, page S12; 81; 82; 85; 126, figure 1A; 135; 156; 157; 164; 215; 223; 224; 227; 229, figure 1; 237; 244, figures 7 and 8; 247; 249; 264; 272], as has the lower atmosphere [3; 8; 25 - 28; 29, figure 3; 34; 63, figure 4; 65, page S17]. Other indirect measures [72; 216, from 6:10 to 7:36; 266], such as melting ice [72; 165 - 170; 180; 181; 184 - 187; 195; 208; 232; 240; 272; 275; 282] sea level rise acceleration [65, page S85; 72; 171 - 181; 184; 191, figure 3 on page 8; 213; 238; 248; 267], increasing geopotential height due to thermal expansion of the lower atmosphere [288 - 290, made using 49, as per 50 (with 291 - 293 and 336 - 338)], and increases in temperature extremes [65, page S17; 209; 210; 213], indicated warming as well. This warming was reflected in the difference between the amount of energy Earth takes up vs. the amount of energy Earth release, as indicated by continued warming of deeper ocean regions [17; 22; 30; 31; 32, figure 3; 57; 62; 64; 65, page S76; 138; 152; 153; 160; 212; 217; 243; 254; 255; 272; 280]. Ocean warming is the main metric of note, since ~90% of the excess energy goes into warming the oceans [17; 22; 32; 62; 72; 138; 160; 243; 254; 255; 280].
One should expect future contrarians/denialists to continue abusing anomalously warm years in order to avoid acknowledging the magnitude of human-made global warming. Take the example of as ocean cycle known as the El Niño Southern Oscillation (ENSO), with its warm El Niño phase and cool La Niña phase [3; 246]. Future contrarians/denialism will likely continue doing at least one of the following:
One should expect future contrarians/denialists to continue abusing anomalously warm years in order to avoid acknowledging the magnitude of human-made global warming. Take the example of as ocean cycle known as the El Niño Southern Oscillation (ENSO), with its warm El Niño phase and cool La Niña phase [3; 246]. Future contrarians/denialism will likely continue doing at least one of the following:
- cherry-pick temperature trends that have an El Niño at (or soon after) their beginning, and/or have a La Niña at (or soon before) their end, in order to claim global warming paused, stopped, etc.
- if a temperature trend ends on an El Niño year, claim the warming trend is just due to El Niño or some other non-human-made factor
- focus on shorter-term temperature trend fluctuations, instead of longer-term, multi-decadal time-scales at which the effect of human-made greenhouse-gas-induced warming becomes more apparent
Note that contrarians will likely use these strategies to emphasis periods where ENSO and/or other forms of natural variability temporarily decelerate a global warming trend, while conveniently downplaying times at which this natural variability temporarily accelerates the trend [250 - 253].
I address strategy 1 in this blogpost, along with in section 3.4 of "John Christy, Climate Models, and Long-term Tropospheric Warming" and https://twitter.com/AtomsksSanakan/status/998042024204013568. I also discuss strategy 2 in "Myth: El Niño Caused Post-1997 Global Warming".
I address strategy 1 in this blogpost, along with in section 3.4 of "John Christy, Climate Models, and Long-term Tropospheric Warming" and https://twitter.com/AtomsksSanakan/status/998042024204013568. I also discuss strategy 2 in "Myth: El Niño Caused Post-1997 Global Warming".
2. Context and Analysis
The near-surface air above oceans and land warmed over the past two decades [8 - 24; 35 - 39; 45 - 47; 51 - 56; 58; 65, page S12; 81; 82; 85; 126, figure 1A; 135; 156; 157; 164; 215; 223; 224; 227; 229, figure 1; 237; 244, figures 7 and 8; 247; 249; 264; 272]. Satellite and weather balloon (radiosonde) analyses also revealed warming of the troposphere, a lower region of the atmosphere where much of Earth's weather occurs [3; 8; 25 - 28; 29, figure 3; 34; 63, figure 4; 65, page S17]. Indirect measures [72; 216, from 6:10 to 7:36; 266], such as melting ice [72; 165 - 170; 180; 181; 184 - 187; 195; 208; 232; 240; 272; 275; 282], sea level rise acceleration [65, page S85; 72; 171 - 181; 184; 191, figure 3 on page 8; 213; 238; 248; 267], increasing geopotential height due to thermal expansion of the lower atmosphere [288 - 290, made using 49, as per 50 (with 291 - 293 and 336 - 338)], and increases in temperature extremes [65, page S17; 209; 210], pointed to warming as well. These two decades of warming were reflected in Earth's energy balance, a measure of the amount of energy Earth takes up vs. the amount of energy Earth releases; continued warming of the deeper ocean reflects this energy imbalance [17; 22; 30; 31; 32, figure 3; 57; 62; 64; 65, page S76; 138; 152; 153; 160; 212; 217; 243; 254; 255; 272; 280], since ~90% of the excess energy goes into warming the oceans [17; 22; 32; 62; 72; 138; 160; 243; 254; 255; 280].
The near-surface air above oceans and land warmed over the past two decades [8 - 24; 35 - 39; 45 - 47; 51 - 56; 58; 65, page S12; 81; 82; 85; 126, figure 1A; 135; 156; 157; 164; 215; 223; 224; 227; 229, figure 1; 237; 244, figures 7 and 8; 247; 249; 264; 272]. Satellite and weather balloon (radiosonde) analyses also revealed warming of the troposphere, a lower region of the atmosphere where much of Earth's weather occurs [3; 8; 25 - 28; 29, figure 3; 34; 63, figure 4; 65, page S17]. Indirect measures [72; 216, from 6:10 to 7:36; 266], such as melting ice [72; 165 - 170; 180; 181; 184 - 187; 195; 208; 232; 240; 272; 275; 282], sea level rise acceleration [65, page S85; 72; 171 - 181; 184; 191, figure 3 on page 8; 213; 238; 248; 267], increasing geopotential height due to thermal expansion of the lower atmosphere [288 - 290, made using 49, as per 50 (with 291 - 293 and 336 - 338)], and increases in temperature extremes [65, page S17; 209; 210], pointed to warming as well. These two decades of warming were reflected in Earth's energy balance, a measure of the amount of energy Earth takes up vs. the amount of energy Earth releases; continued warming of the deeper ocean reflects this energy imbalance [17; 22; 30; 31; 32, figure 3; 57; 62; 64; 65, page S76; 138; 152; 153; 160; 212; 217; 243; 254; 255; 272; 280], since ~90% of the excess energy goes into warming the oceans [17; 22; 32; 62; 72; 138; 160; 243; 254; 255; 280].
The figures below illustrate some of this recent warming:

Figure 1: Comparison of ocean temperature records from 1997 to 2015 for different sources, relative to a 1997-2001 baseline. The sources are buoys, the NOAA's (National Ocean and Atmospheric Association) Extended Reconstructed Sea Surface Temperature (ERSST) record for both ERSSTv3b and the updated ERSSTv4, and the European Space Agency Climate Change Initiative (CCI) [13, figure 1].
The figures below illustrate some of this recent warming:
 |
Figure 1: Comparison of ocean temperature records from 1997 to 2015 for different sources, relative to a 1997-2001 baseline. The sources are buoys, the NOAA's (National Ocean and Atmospheric Association) Extended Reconstructed Sea Surface Temperature (ERSST) record for both ERSSTv3b and the updated ERSSTv4, and the European Space Agency Climate Change Initiative (CCI) [13, figure 1].
|

Figure 2: Comparison of ocean temperature records from 1997 to 2015 for different sources. NOAA's Extended Reconstructed Sea Surface Temperature (ERSST) record for ERSSTv3b and ERSSTv4 are compared to ocean heat measurements from Argo floats. Argo(H2008), Argo(APDRC), and Argo(RG2000) represent three different near-surface temperature data-sets derived from the Argo data. ERSSTv4 data is presented relative to a 1997-2001 baseline, while the other data sources are aligned to the 2005-2007 baseline for ERSSTv4 [13, figure S2].
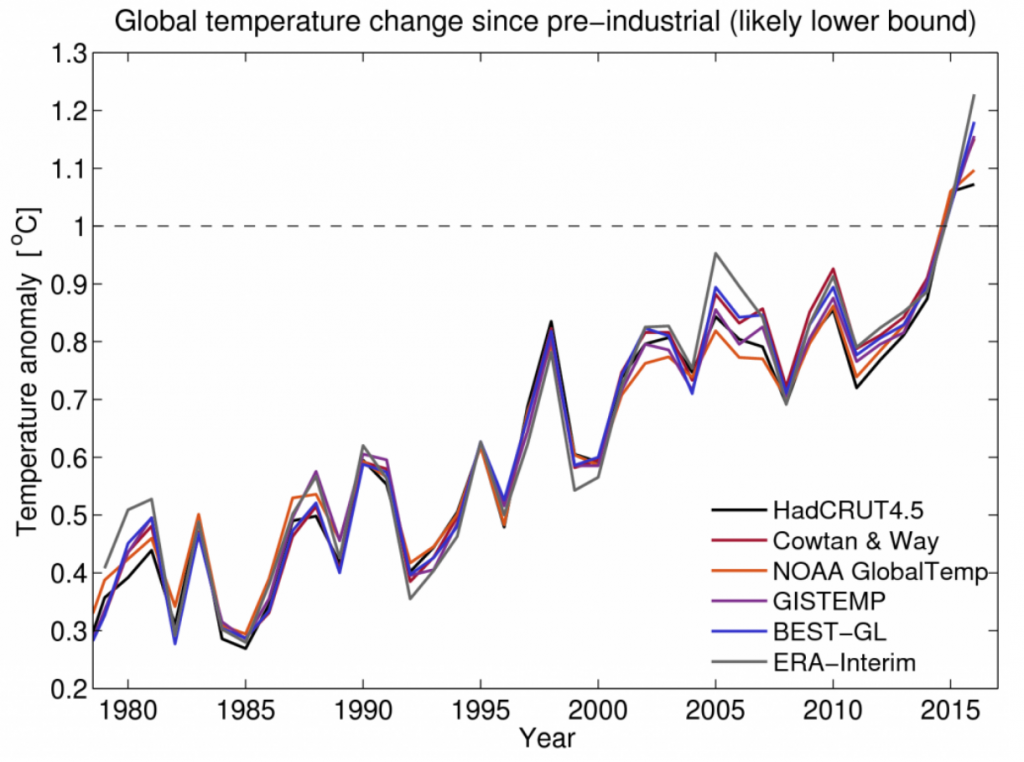
Figure 3: Global, annual, mean surface temperature relative to mean temperature during pre-industrial era (1720 - 1800), or relative to mean temperature from 1986 - 2005 in the case of ERA-Interim, as shown in multiple temperature analyses. Pre-2016 data came from a previous scientific publication [9, figure 5], with later data added in a subsequent analysis [33]. This post-1997 warming trend continues through 2018, as shown using an online tool [49] summarized in a published paper [50]. This is illustrated for HadCRUT4 [51], NOAA GlobalTemp [51], GISTEMP [52], BEST [52], JMA [53], ERA-Interim [53], JRA-55 [54], and MERRA-2 [54], with MERRA-2 having an anomalously low post-1997 warming trend. HadCRUT4 and NOAA GlobalTemp under-estimate post-1997 warming due to their poorer coverage of the globe [8, section 4; 11; 18, figure 1; 46; 56; 58 - 61; 73 - 75; 135; 137, figure 1, sections 4.2.2 and 4.2.3; 214; 231], though more recent work shows improved coverage in the NOAA analysis [249; 264].

Figure 4: Global, annual, mean surface temperature relative to mean temperature from 1961 - 1990 [55, figure 1b]. I discuss the temperature trend (especially from the 1940s to the 1970s) in the context of a near-linear carbon-dioxide-induced warming trend, in sections 2.5 and 2.10 of "Myth: Attributing Warming to CO2 Involves the Fallaciously Inferring Causation from a Mere Correlation".
Other sources [65, page S12; 79; 126, figure 1A; 151, figure 1; 229, figure 1] offer a similar depiction, but with the addition of four more analyses, including an analysis from the Japanese Meteorological Association (JMA) [65, page S12; 79]. The JMA provides a post-1890 land+ocean analysis [65, page S12; 77, made using 49, as per 50; 80 - 83] with less global coverage [81, section 7.4; 83, section 3], while the China Meteorological Agency (CMA) also provides a post-1900 global land analysis [21; 84; 88; 182; 339], as do others [236; 245], including for the post-1983 period [236; 237; 245]. The CMA recently provided a post-1900 global land+ocean analysis well [264; 339]. Other ocean temperatures analyses exist, confirming recent warming as well [244]. The above figure includes neither the CMA analysis nor the JMA analysis, but both analyses show a similar pattern of 1900s - 1940s warming, temperature stagnation or slight cooling from the 1940s - 1960s, and post-1960s warming [21, figure 1a; 77, made using 49, as per 50; 79 - 81; 264; 339].
This figure may overestimate 1940s - 1970s cooling due to uncertainties tied to changes in temperature monitoring practices during World War II [45; 224 - 226], as I discuss in "Myth: Karl et al. of the NOAA Misleadingly Altered Ocean Temperature Records to Increase Global Warming.
 |
Figure 2: Comparison of ocean temperature records from 1997 to 2015 for different sources. NOAA's Extended Reconstructed Sea Surface Temperature (ERSST) record for ERSSTv3b and ERSSTv4 are compared to ocean heat measurements from Argo floats. Argo(H2008), Argo(APDRC), and Argo(RG2000) represent three different near-surface temperature data-sets derived from the Argo data. ERSSTv4 data is presented relative to a 1997-2001 baseline, while the other data sources are aligned to the 2005-2007 baseline for ERSSTv4 [13, figure S2]. |
|
Figure 3: Global, annual, mean surface temperature relative to mean temperature during pre-industrial era (1720 - 1800), or relative to mean temperature from 1986 - 2005 in the case of ERA-Interim, as shown in multiple temperature analyses. Pre-2016 data came from a previous scientific publication [9, figure 5], with later data added in a subsequent analysis [33]. This post-1997 warming trend continues through 2018, as shown using an online tool [49] summarized in a published paper [50]. This is illustrated for HadCRUT4 [51], NOAA GlobalTemp [51], GISTEMP [52], BEST [52], JMA [53], ERA-Interim [53], JRA-55 [54], and MERRA-2 [54], with MERRA-2 having an anomalously low post-1997 warming trend. HadCRUT4 and NOAA GlobalTemp under-estimate post-1997 warming due to their poorer coverage of the globe [8, section 4; 11; 18, figure 1; 46; 56; 58 - 61; 73 - 75; 135; 137, figure 1, sections 4.2.2 and 4.2.3; 214; 231], though more recent work shows improved coverage in the NOAA analysis [249; 264].
|
 |
Figure 4: Global, annual, mean surface temperature relative to mean temperature from 1961 - 1990 [55, figure 1b]. I discuss the temperature trend (especially from the 1940s to the 1970s) in the context of a near-linear carbon-dioxide-induced warming trend, in sections 2.5 and 2.10 of "Myth: Attributing Warming to CO2 Involves the Fallaciously Inferring Causation from a Mere Correlation". Other sources [65, page S12; 79; 126, figure 1A; 151, figure 1; 229, figure 1] offer a similar depiction, but with the addition of four more analyses, including an analysis from the Japanese Meteorological Association (JMA) [65, page S12; 79]. The JMA provides a post-1890 land+ocean analysis [65, page S12; 77, made using 49, as per 50; 80 - 83] with less global coverage [81, section 7.4; 83, section 3], while the China Meteorological Agency (CMA) also provides a post-1900 global land analysis [21; 84; 88; 182; 339], as do others [236; 245], including for the post-1983 period [236; 237; 245]. The CMA recently provided a post-1900 global land+ocean analysis well [264; 339]. Other ocean temperatures analyses exist, confirming recent warming as well [244]. The above figure includes neither the CMA analysis nor the JMA analysis, but both analyses show a similar pattern of 1900s - 1940s warming, temperature stagnation or slight cooling from the 1940s - 1960s, and post-1960s warming [21, figure 1a; 77, made using 49, as per 50; 79 - 81; 264; 339]. This figure may overestimate 1940s - 1970s cooling due to uncertainties tied to changes in temperature monitoring practices during World War II [45; 224 - 226], as I discuss in "Myth: Karl et al. of the NOAA Misleadingly Altered Ocean Temperature Records to Increase Global Warming. |

Figure 5: Trend in global, monthly, mean surface temperature from 1979 to 2016 relative to baseline of 1981 - 2010, as shown in multiple temperature analyses. The solid green trend-line is represents the trend for 1998 - 2012, while the dotted black trend-line represents the trend for the full period from 1979 - 2016 [8, figure 3]. This image was updated through 2019 in a subsequent paper [340, figure 21].
 |
Figure 5: Trend in global, monthly, mean surface temperature from 1979 to 2016 relative to baseline of 1981 - 2010, as shown in multiple temperature analyses. The solid green trend-line is represents the trend for 1998 - 2012, while the dotted black trend-line represents the trend for the full period from 1979 - 2016 [8, figure 3]. This image was updated through 2019 in a subsequent paper [340, figure 21]. |

Figure 6: Version 3.3 and version 4.0 of the Remote Sensing Systems (RSS) global lower tropospheric temperature analysis, along with version 5.6 and version 6.0 of the University of Alabama in Huntsville (UAH) global lower tropospheric temperature analysis. RSS version 4.0 is an update of RSS version 3.3, while UAH version 6.0 is an update of UAH version 5.6. The lower lines (black, gray, red, and pink) indicate temperature relative to a baseline of 1979 - 1981. The upper lines (green and purple) display the difference between the relative temperature values. Quantified trends are from 1979 - 2016 [27].
 |
Figure 6: Version 3.3 and version 4.0 of the Remote Sensing Systems (RSS) global lower tropospheric temperature analysis, along with version 5.6 and version 6.0 of the University of Alabama in Huntsville (UAH) global lower tropospheric temperature analysis. RSS version 4.0 is an update of RSS version 3.3, while UAH version 6.0 is an update of UAH version 5.6. The lower lines (black, gray, red, and pink) indicate temperature relative to a baseline of 1979 - 1981. The upper lines (green and purple) display the difference between the relative temperature values. Quantified trends are from 1979 - 2016 [27]. |
 |
Figure 7: Global lower tropospheric temperature trend up to 2017, as estimated by various re-analyses that include data from diverse sources, radiosonde-based (weather-balloon-based) analyses, and satellite-based analyses. The colored lines indicate temperature relative to a baseline of 1981 - 2010 [65, page S17]. The satellite-based analyses likely under-estimate lower tropospheric warming [161, figure 10] over the past two decades, as admitted by the RSS satellite-based team [27, page 7715; 110]. I discuss this further in section 2.2 of
"Myth: Evidence Supports Curry's Claims Regarding Satellite-based Analyses and the Hot Spot". |
 |
| Figure 8: (A, Top panel) Global relative mid- to upper tropospheric temperature trend from 1979 - 2017, estimated as an average of the UAH, NOAA/STAR, and RSS satellite-based analyses. (B, Bottom panel) 20-year mid- to upper tropospheric temperature trends for the satellite-based analyses. The year on the x-axis denotes the endpoint for the 20-year trend, while the y-axis represents the magnitude of the warming trend. Solid lines indicate the newest versions of each satellite-based analysis, while the dotted lines represent older versions [25]. |

Figure 9: 1993 - 2017 relative ocean heat content (OHC) from an ocean depth of 0 meters to 700 meters, as estimated using different analyses. Estimates are in ZJ, where 1 ZJ = 10^21 joules of energy. The estimates are first offset (vertically on the plot) relative to their individual 2005 - 2017 mean, and then offset relative to their collective 1993 mean. The year 1995 is represented by the first hash mark on the x-axis, with hash marks for at each subsequent 5-year interval. Errors bars represent standard error of the mean [65, page S76].

Figure 10: 1955 - 2015, or 1957 - 2014, relative ocean heat content, as estimated using different analyses. The measured ocean depth is from 0 meters to 700 meters, or from 700 meters to 2000 meters. The two NCEI lines [22, figure 4B] come from the same source as the NCEI analyses in figure 9 [65, page S76], while the two remaining lines come from IAP/CAS in figure 9 [65, page S76]. The figure 10 IAP/CAS estimate is relative to a 1997 - 2005 base period, while NCEI is adjusted relative to IAP/CAS' 2005 - 2014 values. IAP/CAS shading represents +/- 2-sigma uncertainty, while the dashed lines for NCEI reflect standard error. NCEI results cover 1957 - 2014, while IAP/CAS results cover 1955 - 2015 [22, figure 4B].
 |
Figure 9: 1993 - 2017 relative ocean heat content (OHC) from an ocean depth of 0 meters to 700 meters, as estimated using different analyses. Estimates are in ZJ, where 1 ZJ = 10^21 joules of energy. The estimates are first offset (vertically on the plot) relative to their individual 2005 - 2017 mean, and then offset relative to their collective 1993 mean. The year 1995 is represented by the first hash mark on the x-axis, with hash marks for at each subsequent 5-year interval. Errors bars represent standard error of the mean [65, page S76].
|
 |
Figure 10: 1955 - 2015, or 1957 - 2014, relative ocean heat content, as estimated using different analyses. The measured ocean depth is from 0 meters to 700 meters, or from 700 meters to 2000 meters. The two NCEI lines [22, figure 4B] come from the same source as the NCEI analyses in figure 9 [65, page S76], while the two remaining lines come from IAP/CAS in figure 9 [65, page S76]. The figure 10 IAP/CAS estimate is relative to a 1997 - 2005 base period, while NCEI is adjusted relative to IAP/CAS' 2005 - 2014 values. IAP/CAS shading represents +/- 2-sigma uncertainty, while the dashed lines for NCEI reflect standard error. NCEI results cover 1957 - 2014, while IAP/CAS results cover 1955 - 2015 [22, figure 4B].
|
 |
Figure 11: Relative ocean heat content, as estimated using different analyses. The analyses in question are listed on the left of panel B, with their corresponding colors [160, figures 1A, 1B, and 1C]; other analyses not shown here also show increased ocean heat content [64; 65, page S76] and correspond to the analyses in figures 9 and 10. The GF analysis originated in the paper from which this figure was taken, while the other listed analyses come from previously published research. The analyses cover the latitudes 80°N to 80°S, except for Domingues, which covers 65°N to 65°S. Estimates are in ZJ or ZJ/yr (ZJ per year), where 1 ZJ = 10^21 joules of energy. Estimates are also relative to a 2006 - 2015 baseline, with shading representing the uncertainty for each estimate. (Top inset for each panel) Linear trend in ocean heat content, with error bars, over the periods noted. (Bottom inset for each panel) Relative ocean heat content (A) to a depth of 0 meters to 700 meters, (B) 0 meters to 2000 meters, and (C) below 2000 meters [160, figures 1A, 1B, and 1C (also see: 243, figure 2; 281, figure 14)]. |
As a 2017 paper and 2018 paper noted, respectively:
"Rather, the data are fully consistent with a steady global warming trend since the 1970s, superimposed with random, stationary, short-term variability. All recent variations in short-term trends are well within what was to be expected, based on the observed warming trend and the observed variability from the 1970s up to the year 2000.
[...]
Our purpose has been to determine what can and cannot be said about trends and their changes, based on the temperature data records only. We find that the public discussion of time intervals within the range 1998–2014 as somehow unusual or unexpected, as indicated by terms like 'hiatus', 'pause' and 'slowdown', has no support in rigorous study of the temperature data [emphasis added] [10]."
"The importance of differing definitions of a “hiatus” was discussed in Medhaug et al. [...] where contradictory conclusions can arise in the literature based on the definition. Consequently, elucidating the various different definitions of “pause” or “hiatus” is important.
Among the common definitions of pause/hiatus are: (1) a statistically significant change in the rate of global warming, as measured by changes to the heat balance of the planet; (2) a statistically significant change in the surface temperature record; (3) a non-statistically significant change in the rate of GMST [global mean surface temperature] change; and (4) Divergence between GMST predictions (from climate modes) and actual GMST measurements. Unfortunately, these definitions are often conflated and their separate identities must be maintained.
Among the common definitions of pause/hiatus are: (1) a statistically significant change in the rate of global warming, as measured by changes to the heat balance of the planet; (2) a statistically significant change in the surface temperature record; (3) a non-statistically significant change in the rate of GMST [global mean surface temperature] change; and (4) Divergence between GMST predictions (from climate modes) and actual GMST measurements. Unfortunately, these definitions are often conflated and their separate identities must be maintained.
So, has there been a pause in global warming? The answer would be mistakenly “yes” only if one defines the “global warming” only by GMST changes (definition 3 above) [emphasis added] [138]."
Other studies yielded similar results [8, section 4; 11; 12; 18; 20; 58; 61; 66 - 72; 135; 156; 157; 163, pages 145 and 150; 215; 247]. As shown in figures 4 [55, figure 1b], 7 [65, page S17], 10 [22, figure 4B], 11 [160, figures 1A and 1B], and other sources [29; 76; 77, made using 49, as per 50; 126, figure 1A; 138, figures 1 and 2; 215, table 1; 228; 229, figure 1; 264, figure 8; 265; 272, pages 4 and 5], Earth is in the midst of a global warming trend over 50 years long, extending back to around 1965 and continuing past 1998 to the present. And while the myth falsely claims that the post-1997 time-period constitutes a pause/hiatus in which no global warming occurring, global surface warming instead accelerated, as per figure 12 below (the 2017 paper quoted above [10] excludes recent years of warming, along with excluding various datasets, and thus fails to detect this warming acceleration):
 |
| Figure 12: Relative global surface temperature trend from 1850 - 2017 (observations, for HadOST), with the contribution of various factors to this temperature trend (colored lines) [294; 295]. The gray line is the sum of each of the depicted colored lines. The surface temperature trend takes into account changes in sea surface temperature measuring practices during the 1930s and 1940s, which I elaborate more on in "Myth: Karl et al. of the NOAA Misleadingly Altered Ocean Temperature Records to Increase Global Warming". The authors of this figure adapted it from the results of their 2019 paper. Note that this figure accounts for the long-term global surface temperature trend without recourse to large internal variability in the form of the Atlantic Multi-decadal Oscillation (AMO) [294 - 296; 297, with 298], as did figure 22. This supports the idea that the AMO played little role in driving long-term industrial-era global warming [294 - 296]. This figure displays global warming acceleration post-1998. Post-1998 acceleration also appears in global surface temperature trend analyses such as ERA5 [304 and 305, confirmed using 308 - 310 (made using 49, as per 50); 311 (with 312 - 314)] (which is endorsed by the contrarians Judith Curry [299 - 301] and Ryan Maue [302; 303]), NASA's GISTEMP [305 - 307, confirmed using 315, along with 308 - 310 and 316 - 319 (made using 49, as per 50); 311 (with 312 - 314)], NOAA's global analysis [305, confirmed using 315, along with 320 - 322 (made using 49, as per 50); 311 (with 312 - 314)], NCEP-2 [320 - 322 (made using 49, as per 50); 311 (with 312 - 314)], and 20CR [323 - 325 (made using 49, as per 50)], consistent with other sources on accelerating climate change [152; 169; 176; 184; 186; 208; 212; 227; 232; 238; 240; 326 - 328; 329 (with 330 - 335)]. For further discussion of accelerating warming, see section 2.1 of "Myth: The IPCC's 2007 ~0.2°C/decade Model-based Projection Failed and Judith Curry's Forecast was More Reliable". |
(I discuss longer-term, industrial-era warming trends in sections 2.7 and 2.10 of "Myth: Attributing Warming to CO2 Involves the Fallaciously Inferring Causation from a Mere Correlation". The post-1997 warming cannot be accounted for in terms of an ocean cycle known as the El Niño Southern Oscillation, as I discuss in "Myth: El Niño Caused Most Post-1997 Warming". El Niño, however, does cause a more pronounced warming spike in 1997/1998 and 2015/2016; this spike is greater in the troposphere than at Earth's surface (compare figure 4 to figures 6 and 8) due largely to a short-term "tropospheric hot spot" that I discuss in "Myth: The Tropospheric Hot Spot is a Fingerprint of CO2-induced Warming" Contrarians often cherry-pick the 1997/1998 warm El Niño as their start-point for warming trends, thereby minimizing recent warming as much as they can; the contrarians' cherry-picking comes with the flaws I discuss in section 3.4 of "Christopher Monckton and Projecting Future Global Warming, Part 1", and section 3.4 of "John Christy, Climate Models, and Long-term Tropospheric Warming".)
3. Posts Providing Further Information and Analysis
- "Myth: Karl et al. of the NOAA Misleadingly Altered Ocean Temperature Records to Increase Global Warming"
- Section 3.4 of "John Christy, Climate Models, and Long-term Tropospheric Warming"
- Section 2.10 of "Myth: Attributing Warming to CO2 Involves the Fallaciously Inferring Causation from a Mere Correlation"
- Section 3.4 of part 1 of "Christopher Monckton and Projecting Future Global Warming"
- Section 3.8 of part 2 of "John Christy and the Tropical Tropospheric Hot Spot"
No comments:
Post a Comment