- The Myth and Its Flaw
- Context and Analysis
- Posts Providing Further Information and Analysis
- References
This is the "main version" version of this post, which means that this post lacks most of my references and citations. If you would like a more comprehensive version with all the references and citations, then please go to the "+References" version of this post.
References are cited as follows: "[#]", with "#" corresponding to the reference number given in the References section at the end of this post.
1. The Myth and Its Flaw
The myth claims that an Antarctic ice core revealed a recent rise in carbon dioxide (CO2) levels, without a concurrent rise in temperature. Thus recent CO2 increases did not cause much recent warming.
Proponents of this myth include Tony Heller (a.k.a. Steven Goddard), Javier of Judith Curry's Climate Etc. blog, Iowa Climate Science Education, Patrick Moore, Suspicious0bservers (a.k.a. Ben Davidson), CO2IsLife, and various climate science critics online.
The myth's flaw: The ice core in question lacks data after ~1912. So myth proponents use images that add post-1912 CO2 data to the ice core, without adding post-1912 temperature data. Thus these images lack a temperature spike due to this lack of recent temperature data, not because CO2 does not cause warming. Furthermore, contrarians cherry-pick recent temperature from one location in Antarctica, in order to ignore warming over the rest of the planet. They also ignore the fact that Earth has not reached an equilibrium state in which all the warming from the CO2 rise has occurred. Thus myth proponents are being (intentionally or unintentionally) misleading when they use their images to argue that CO2 did not cause much recent warming.
(I present evidence that increased CO2 caused most of the recent global warming in "Myth: Attributing Warming to CO2 Involves the Fallaciously Inferring Causation from a Mere Correlation".)
potholer54, a.k.a. Peter Hadfield, also addresses Tony Heller's defense of the myth. potholer54 does this by citing published evidence to explain why Antarctic temperature trends during recent industrial-era global warming should not be expected to follow the Antarctic temperature patterns reflected in the ice core record for warming in the most distant past. This is because:
- the initial trigger for warming in the ice core record was changes in Earth's absorption of solar radiation in the southern hemisphere, the hemisphere in which Antarctic is located, while the trigger for industrial-era warming was greenhouse gas release predominately in the northern hemisphere
- man-made ozone-depletion indirectly made significant contributions to industrial-era Antarctic temperature trends, while there is not evidence of ozone-depletion contributing much to Antarctic temperature trends in the ice core record for the distant past
- Antarctica has had less time to respond to recent warming, since industrial-era global warming occurred over a shorter time than warming in ice core record
Thus potholer54 rebuts the myth [16, from 12:47 to 15:04] in a different way than I do, though our explanations remain compatible. So I will not focus on potholer's rebuttal in my discussion in section 2 below.
The myth claims that an Antarctic ice core revealed a recent rise in carbon dioxide (CO2) levels, without a concurrent rise in temperature. Thus recent CO2 increases did not cause much recent warming.
Proponents of this myth include Tony Heller (a.k.a. Steven Goddard), Javier of Judith Curry's Climate Etc. blog, Iowa Climate Science Education, Patrick Moore, Suspicious0bservers (a.k.a. Ben Davidson), CO2IsLife, and various climate science critics online.
Proponents of this myth include Tony Heller (a.k.a. Steven Goddard), Javier of Judith Curry's Climate Etc. blog, Iowa Climate Science Education, Patrick Moore, Suspicious0bservers (a.k.a. Ben Davidson), CO2IsLife, and various climate science critics online.
The myth's flaw: The ice core in question lacks data after ~1912. So myth proponents use images that add post-1912 CO2 data to the ice core, without adding post-1912 temperature data. Thus these images lack a temperature spike due to this lack of recent temperature data, not because CO2 does not cause warming. Furthermore, contrarians cherry-pick recent temperature from one location in Antarctica, in order to ignore warming over the rest of the planet. They also ignore the fact that Earth has not reached an equilibrium state in which all the warming from the CO2 rise has occurred. Thus myth proponents are being (intentionally or unintentionally) misleading when they use their images to argue that CO2 did not cause much recent warming.
(I present evidence that increased CO2 caused most of the recent global warming in "Myth: Attributing Warming to CO2 Involves the Fallaciously Inferring Causation from a Mere Correlation".)
potholer54, a.k.a. Peter Hadfield, also addresses Tony Heller's defense of the myth. potholer54 does this by citing published evidence to explain why Antarctic temperature trends during recent industrial-era global warming should not be expected to follow the Antarctic temperature patterns reflected in the ice core record for warming in the most distant past. This is because:
Thus potholer54 rebuts the myth [16, from 12:47 to 15:04] in a different way than I do, though our explanations remain compatible. So I will not focus on potholer's rebuttal in my discussion in section 2 below.
(I present evidence that increased CO2 caused most of the recent global warming in "Myth: Attributing Warming to CO2 Involves the Fallaciously Inferring Causation from a Mere Correlation".)
potholer54, a.k.a. Peter Hadfield, also addresses Tony Heller's defense of the myth. potholer54 does this by citing published evidence to explain why Antarctic temperature trends during recent industrial-era global warming should not be expected to follow the Antarctic temperature patterns reflected in the ice core record for warming in the most distant past. This is because:
- the initial trigger for warming in the ice core record was changes in Earth's absorption of solar radiation in the southern hemisphere, the hemisphere in which Antarctic is located, while the trigger for industrial-era warming was greenhouse gas release predominately in the northern hemisphere
- man-made ozone-depletion indirectly made significant contributions to industrial-era Antarctic temperature trends, while there is not evidence of ozone-depletion contributing much to Antarctic temperature trends in the ice core record for the distant past
- Antarctica has had less time to respond to recent warming, since industrial-era global warming occurred over a shorter time than warming in ice core record
Thus potholer54 rebuts the myth [16, from 12:47 to 15:04] in a different way than I do, though our explanations remain compatible. So I will not focus on potholer's rebuttal in my discussion in section 2 below.
2. Context and Analysis
Scientists justifiably use correlation between two factors as part of a cumulative case for a causal relationship between those two factors, as I discuss in "Myth: Attributing Warming to CO2 Involves the Fallaciously Inferring Causation from a Mere Correlation". In light of this, some individuals attempt to undermine the case for CO2-induced warming by showing that recent CO2 increases do not correlate with recent temperature changes. Some of these individuals estimate past temperature changes and CO2 levels using proxy data from ice cores in Antarctic. They argue that these ice cores show a recent CO2 rise without a recent rise in temperature; thus increased CO2 does not correlate with recent warming, and CO2 did not cause recent warming. This is the myth this blogpost focuses on.
Below are several images myth proponents present to make their case:
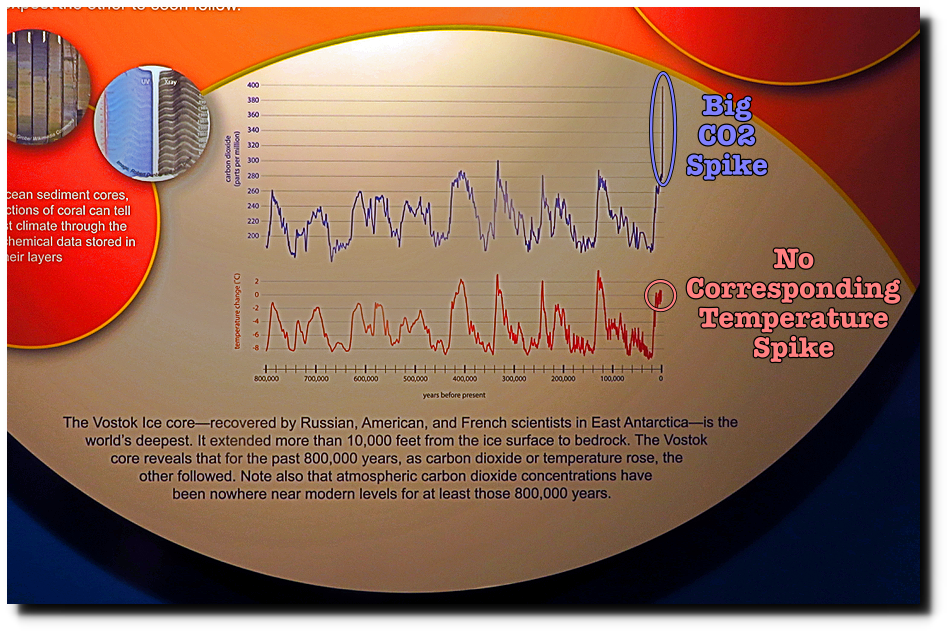
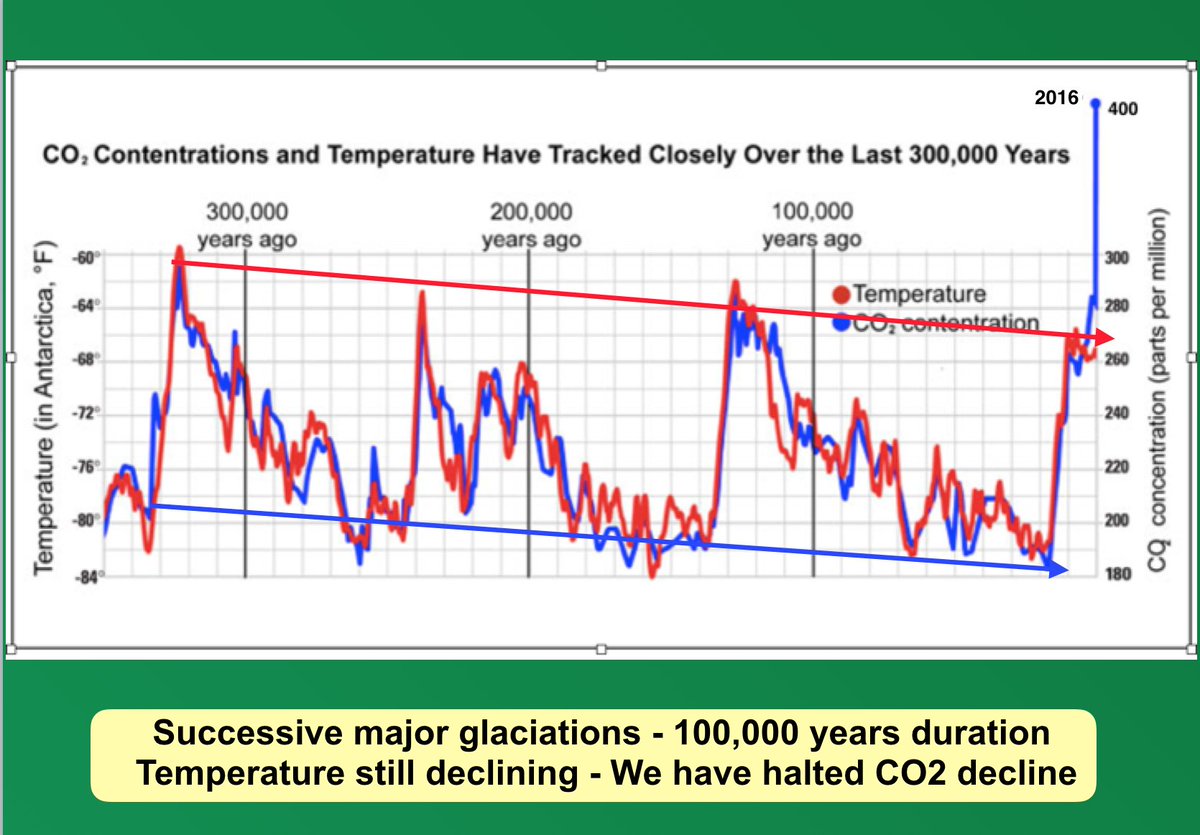

Figure 1: Images arguing against recent, man-made, CO2-induced global warming by comparing estimates of CO2 levels and temperature changes. The estimates are (supposedly) based on data from an Antarctic ice core [1, from 11:26 to 13:42; 2 - 10].
Scientists justifiably use correlation between two factors as part of a cumulative case for a causal relationship between those two factors, as I discuss in "Myth: Attributing Warming to CO2 Involves the Fallaciously Inferring Causation from a Mere Correlation". In light of this, some individuals attempt to undermine the case for CO2-induced warming by showing that recent CO2 increases do not correlate with recent temperature changes. Some of these individuals estimate past temperature changes and CO2 levels using proxy data from ice cores in Antarctic. They argue that these ice cores show a recent CO2 rise without a recent rise in temperature; thus increased CO2 does not correlate with recent warming, and CO2 did not cause recent warming. This is the myth this blogpost focuses on.
Below are several images myth proponents present to make their case:
Below are several images myth proponents present to make their case:
|
| Figure 1: Images arguing against recent, man-made, CO2-induced global warming by comparing estimates of CO2 levels and temperature changes. The estimates are (supposedly) based on data from an Antarctic ice core [1, from 11:26 to 13:42; 2 - 10]. |
But these graphs are very misleading, which becomes clear when one examines the original data analysis for the Antarctic ice core:
 |
Figure 2: CO2 level and temperature change estimated from an Antarctic ice core [11]. The data is taken from two published studies. "Years before present" (BP) for ice cores means "years before 1950"; this point sometimes confuses contrarians. And the aforementioned data stops by about 38 BP, which is equivalent to ~1912. So this figure does not include most of the warming and CO2 increase since the 20th century; CO2 levels are now above 405ppm. 1°C of Antarctic warming translates to ~0.6°C of global warming. |
(In section 2.8 of "Myth: Attributing Warming to CO2 Involves the Fallaciously Inferring Causation from a Mere Correlation", I rebut the argument that figure 2 undermines the case for CO2-induced warming, since figure 2 shows that CO2 increases lag temperature increases.)
Thus figure 1's recent CO2 increase from 280 parts per million (ppm) to ~400 ppm was not present in the original Antarctic analysis presented in figure 2. This CO2 spike instead likely came from data collected in Mauna Loa, Hawaii up to the year 2015. Figures 2's CO2 and temperature estimate stops by about 38 "years before present", where "years before present" means "years before 1950" for ice cores. So the ice core estimate stops by about 1912. Myth advocates add recent CO2 data to this analysis without adding recent temperature data. They then use this to argue against CO2 causing recent global warming. But the myth defenders' argument fails, since the myth proponents excluded the recent temperature data needed to justify their conclusion.
When I pointed this out this evidence to the debunked myth proponent and conspiracy theorist Tony Heller (a.k.a. Steven Goddard), this was his entire response:
"What a load of BS [12]."
Thus Tony Heller resorts to denialism in order to defend his myth. Science denialists refuses to accept scientific claims supported by strong evidence. The following sources provide further context on what denialism is:
"It is, however, important not to confuse denialism with genuine scepticism, which is essential for scientific progress. Sceptics are willing to change their minds when confronted with new evidence; deniers are not [13]."
"The crucial difference is that your colleagues will accept a scientific statement if provided with sufficiently strong reasons to do so. In contrast, climate science denialists, like other pseudoscientists, tend to be driven by motives that make them impossible to convince, however strong the arguments they are presented with [14]."
So what do recent Antarctic temperature trends show? Figure 3 helps answer this question by presenting temperature trends from Antarctica and other regions on Earth:
 |
| Figure 3: Temperature trends since AD 1500 in different regions. 15-year trends are shown as thin black curves and 50-year trends are shown as thick black curves. The vertical black bar indicates the median time at which sustained, significant industrial-era warming began in that region. The gray 1°C scale bar represents 1K of temperature change on the y-axis for each regional temperature trend [15, figure 2 on page 413]. |
So despite the fact that some Antarctic regions warmed, with analyses showing Antarctic surface warming and warming of the lower atmosphere, Antarctica and the Southern Ocean as a whole most likely did not significantly warm (though there is significant uncertainty for 20th century Antarctic temperature records, with some results suggesting cooling of the Antarctic lower atmosphere). Some early climate models projected this result, while Antarctic temperature trends are on the very low end of the range of projections from some later climate models. So the lack of robust Antarctic warming in figure 3 is not a total surprise.
Myth proponents engage in cherry-picking if they use this Antarctic trend to argue against recent global warming, especially since figure 3 shows warming elsewhere in the world and there is abundant evidence of Earth's surface warming. In contrast, figure 2 does not commit cherry-picking, since climate scientists also use proxies outside of Antarctica to confirm warming. But suppose Antarctic proxies were the only proxies available for temperature changes in the distant past. Then scientists would still not be guilty of cherry-picking in their use of figure 2, because the charge of cherry-picking does not apply in situations where one only has one option to choose from.
Returning from warming in the distant past to more recent warming: the industrial-era warming from figure 3 likely under-estimates the warming caused by CO2 increasing from 280ppm to ~405ppm. This is due to thermal inertia and the fact that Earth has yet to reach an equilibrium state in which Earth stops warming because Earth's release of energy into space matches the solar energy Earth takes in (I discuss this more in sections 2.2, 2.5, and 2.8 of "Myth: Attributing Warming to CO2 Involves the Fallaciously Inferring Causation from a Mere Correlation"). So even if myth proponents modified figure 1 to include industrial-era global warming, they would still fail in their goal of arguing that CO2 does not cause a significant amount of global warming.
3. Posts Providing Further Information and Analysis
- Sections 2.1, 2.8, and 2.10 of "Myth: Attributing Warming to CO2 Involves the Fallaciously Inferring Causation from a Mere Correlation"
- Sections 2.1, 2.8, and 2.10 of "Myth: Attributing Warming to CO2 Involves the Fallaciously Inferring Causation from a Mere Correlation"
No comments:
Post a Comment