- Summary and Objections to the Myth
- Elaboration on the Myth
- Elaborations on the Objections
- Posts Providing Further Information and Analysis
- References
Each numbered point in section 1 corresponds with a numbered portion of section 3. So there is no need to read this entire post; instead, you can look at section 1 to see which numbered point you find interesting, and then go to the corresponding numbered portion in section 3 for further details.
This is the "+References" version of this post, which means that this post contains my full list of references and citations. If you would like an abbreviated and easier to read version, then please go to the "main version" of this post.
References are cited as follows: "[#]", with "#" corresponding to the reference number given in the References section at the end of this post.
1. Summary and Objections to the Myth
Climate scientists John Christy and Richard McNider published a paper examining warming in the lower atmosphere. They use this analysis to argue that climate models exaggerate [1; 9] a parameter known as climate sensitivity [2 - 7; 21]; this implies that the models over-estimate warming caused by carbon dioxide (CO2) [1]. Christy+McNider's claim that models over-estimate climate sensitivity is the myth I focus on in this blogpost.
Proponents of this myth include John Christy [1], Richard McNider [1], Paul Homewood [8], Anthony Watts [9], Michael Kile of Quadrant [10], The Daily Caller [11], the Global Warming Policy Foundation [12], Investor's Business Daily [13], Rick Moran of American Thinker [220], Rush Limbaugh [14], Cornwall Alliance [15] (Cornwall Alliance's position on climate science is motivated, in part, by the Alliance's religious and political ideology [16; 17]), and a number of other Internet sources [18 - 20].
The myth's flaw: Christy+McNider fail to adequately support their climate sensitivity estimate, since:
- 3.1 : Christy+McNider under-estimate atmospheric warming and thus under-estimate climate sensitivity
- 3.2 : Christy+McNider do not adequately address other explanations for estimates of atmospheric warming; these explanations would not imply that climate models over-estimate climate sensitivity
- 3.3 : their account of low climate sensitivity runs afoul of published evidence on factors that augment or mitigate climate sensitivity
- 3.4 : their climate sensitivity estimate remains less reliable than sensitivity estimates from other sources
- 3.5 : Christy+McNider undermine their own reasoning and clearly contradict Christy's position; this suggests that Christy may not believe what he says
- 3.6 : Christy+McNider do not adequately account for the impact of the Sun, thereby under-estimating climate sensitivity and further contradicting Christy's position; this again suggests that Christy may not believe what he says
Some myth proponents used Christy+McNider's work to justify other myths, including the claim that there has been no atmospheric warming for two decades [18]. I address these auxiliary myths in section 3.7.
2. Elaboration on the Myth
A significant proportion of climate science focuses on climate sensitivity, an estimate how much warming CO2 causes [2 - 7; 21]. Positive feedbacks, in response to warming, amplify warming and thus increase climate sensitivity. In contrast, negative feedbacks, in response to warming, mitigate warming and thus decrease climate sensitivity [21; 22; 426].
Equilibrium climate sensitivity (ECS) is climate sensitivity when Earth is in an equilibrium state where Earth releases as much energy as it takes in, and fast feedbacks (as opposed to slower acting feedbacks) have exerted their full effect [21; 23]. Transient climate sensitivity (TCS or TCR) is Earth's climate sensitivity over a shorter period of time, before Earth reaches equilibrium [21; 23]. Different scientists give different definitions for climate sensitivity and ECS [2], but the aforementioned definitions should suffice for this blogpost.
Scientists can estimate climate sensitivity using climate models, data from the distant past (paleoclimate data), and data from the more recent past covering the past two centuries (historical or instrumental data) [2; 3; 23]; I discuss this further in section 1 of Christopher Monckton and Projecting Future Global Warming, Part 1. Figure 1 presents estimates of climate sensitivity from research surveyed by the United Nations Intergovernmental Panel on Climate Change (IPCC) [24, figure 10.20 on page 925]:

Figure 1: Estimates of (a) TCR and (b) ECS from the scientific literature. The histogram height is proportional to the relative probability that CS is at the value shown on the horizontal axis. For example, the bottom panel on (b) includes Aldrin et al. 2012, where the maximum value for the histogram is around 1.7K, indicating that 1.7K is the most likely value for ECS of all possible ECS values examine in Aldrin et al. 2012. Horizontal bars show the probability range and the circles mark the median estimate. The dashed lines in (a) show estimates from a previous IPCC report (AR4). The boxes on the right-hand side indicate limitations and strengths of each line of evidence. A blue box implies an overall line of evidence that is well understood, has small uncertainty, or many studies and overall high confidence. Pale yellow indicates medium confidence, and dark red implies low confidence [24, figure 10.20 of page 925].
The IPCC offers a central TCR estimate of ~1.8K, and a central ECS estimate of ~3K [24, page 871 and figure 10.20 of page 925], consistent with the values produced by various climate models [2; 36, figure 5]. I will refer to these as high estimates of climate sensitivity in this blogpost.
Christy+McNider estimate climate sensitivity by examining global warming trends in the troposphere, a lower layer of the atmosphere. They estimate tropospheric warming using a satellite-based analysis from a research team at the University of Alabama in Huntsville (UAH) [1]; Christy and McNider are both members of this UAH team.
Christy+McNider take UAH's tropospheric warming trend, and remove the effect of ocean warming cycles that also warm the troposphere; this is their "sea surface temperature" or "SST" adjustment [1, pages 512 and 513]. Christy+McNider also remove the effect of volcanic aerosols on tropospheric temperature [1, pages 513 and 514]. They then assume that human activity caused the warming that remained after removing the effects of SST and volcanic aerosols. They finally estimate TCR by estimating the contribution of CO2 to this human-induced warming trend [1, page 514].
So how does Christy+McNider's TCR estimate compare to the IPCC's estimate from figure 1? One cannot do a direct comparison of the two estimates, since the IPCC's estimate is for CO2-induced warming of Earth's surface, while Christy+McNider's estimate is for CO2-induced warming of Earth's troposphere. Tropospheric warming trends are not equivalent to surface warming trends, since the troposphere should warm more than the surface, particularly in the tropics [25, pages 4 and 22; 26 - 29; 30, from 31:01 to 31:48; 31 - 33; 34, pages 7 and 8; 35, pages 101 and 102] (I discuss why in "Myth: The Tropospheric Hot Spot is a Fingerprint of CO2-induced Warming"). Christy+McNider account for this difference in warming rates for the surface vs. the troposphere [1, page 515], which allows them to compare their climate sensitivity estimate to that of IPCC.
Based on a calculation offered by Christy+McNider [1, page 515], their tropospheric TCR estimate of 1.10K +/- 0.26K [1, page 511] translates into a surface TCR estimate of 0.93K +/- 0.22K. This lies on the very low end of the IPCC's 1K - 2.5K TCR estimate range from figure 1a above [24, figure 10.20 on page 925]. One could push Christy+McNider's estimate further below the IPCC's range, if one opted for two other calculations offered by Christy+McNider [1, page 515].
So Christy+McNider's estimate climate sensitivity to be about half the IPCC's central estimate of ~1.8K and about half the estimate from the climate models used by IPCC. Thus, according to Christy+McNider, the IPCC and mainstream climate models may over-estimate CO2-induced warming [1]. This is the central myth I address in this blogpost.
A significant proportion of climate science focuses on climate sensitivity, an estimate how much warming CO2 causes [2 - 7; 21]. Positive feedbacks, in response to warming, amplify warming and thus increase climate sensitivity. In contrast, negative feedbacks, in response to warming, mitigate warming and thus decrease climate sensitivity [21; 22; 426].
Equilibrium climate sensitivity (ECS) is climate sensitivity when Earth is in an equilibrium state where Earth releases as much energy as it takes in, and fast feedbacks (as opposed to slower acting feedbacks) have exerted their full effect [21; 23]. Transient climate sensitivity (TCS or TCR) is Earth's climate sensitivity over a shorter period of time, before Earth reaches equilibrium [21; 23]. Different scientists give different definitions for climate sensitivity and ECS [2], but the aforementioned definitions should suffice for this blogpost.
Equilibrium climate sensitivity (ECS) is climate sensitivity when Earth is in an equilibrium state where Earth releases as much energy as it takes in, and fast feedbacks (as opposed to slower acting feedbacks) have exerted their full effect [21; 23]. Transient climate sensitivity (TCS or TCR) is Earth's climate sensitivity over a shorter period of time, before Earth reaches equilibrium [21; 23]. Different scientists give different definitions for climate sensitivity and ECS [2], but the aforementioned definitions should suffice for this blogpost.
Scientists can estimate climate sensitivity using climate models, data from the distant past (paleoclimate data), and data from the more recent past covering the past two centuries (historical or instrumental data) [2; 3; 23]; I discuss this further in section 1 of Christopher Monckton and Projecting Future Global Warming, Part 1. Figure 1 presents estimates of climate sensitivity from research surveyed by the United Nations Intergovernmental Panel on Climate Change (IPCC) [24, figure 10.20 on page 925]:
 |
Figure 1: Estimates of (a) TCR and (b) ECS from the scientific literature. The histogram height is proportional to the relative probability that CS is at the value shown on the horizontal axis. For example, the bottom panel on (b) includes Aldrin et al. 2012, where the maximum value for the histogram is around 1.7K, indicating that 1.7K is the most likely value for ECS of all possible ECS values examine in Aldrin et al. 2012. Horizontal bars show the probability range and the circles mark the median estimate. The dashed lines in (a) show estimates from a previous IPCC report (AR4). The boxes on the right-hand side indicate limitations and strengths of each line of evidence. A blue box implies an overall line of evidence that is well understood, has small uncertainty, or many studies and overall high confidence. Pale yellow indicates medium confidence, and dark red implies low confidence [24, figure 10.20 of page 925]. |
Christy+McNider estimate climate sensitivity by examining global warming trends in the troposphere, a lower layer of the atmosphere. They estimate tropospheric warming using a satellite-based analysis from a research team at the University of Alabama in Huntsville (UAH) [1]; Christy and McNider are both members of this UAH team.
Christy+McNider take UAH's tropospheric warming trend, and remove the effect of ocean warming cycles that also warm the troposphere; this is their "sea surface temperature" or "SST" adjustment [1, pages 512 and 513]. Christy+McNider also remove the effect of volcanic aerosols on tropospheric temperature [1, pages 513 and 514]. They then assume that human activity caused the warming that remained after removing the effects of SST and volcanic aerosols. They finally estimate TCR by estimating the contribution of CO2 to this human-induced warming trend [1, page 514].
So how does Christy+McNider's TCR estimate compare to the IPCC's estimate from figure 1? One cannot do a direct comparison of the two estimates, since the IPCC's estimate is for CO2-induced warming of Earth's surface, while Christy+McNider's estimate is for CO2-induced warming of Earth's troposphere. Tropospheric warming trends are not equivalent to surface warming trends, since the troposphere should warm more than the surface, particularly in the tropics [25, pages 4 and 22; 26 - 29; 30, from 31:01 to 31:48; 31 - 33; 34, pages 7 and 8; 35, pages 101 and 102] (I discuss why in "Myth: The Tropospheric Hot Spot is a Fingerprint of CO2-induced Warming"). Christy+McNider account for this difference in warming rates for the surface vs. the troposphere [1, page 515], which allows them to compare their climate sensitivity estimate to that of IPCC.
Based on a calculation offered by Christy+McNider [1, page 515], their tropospheric TCR estimate of 1.10K +/- 0.26K [1, page 511] translates into a surface TCR estimate of 0.93K +/- 0.22K. This lies on the very low end of the IPCC's 1K - 2.5K TCR estimate range from figure 1a above [24, figure 10.20 on page 925]. One could push Christy+McNider's estimate further below the IPCC's range, if one opted for two other calculations offered by Christy+McNider [1, page 515].
So Christy+McNider's estimate climate sensitivity to be about half the IPCC's central estimate of ~1.8K and about half the estimate from the climate models used by IPCC. Thus, according to Christy+McNider, the IPCC and mainstream climate models may over-estimate CO2-induced warming [1]. This is the central myth I address in this blogpost.
3. Elaboration on the Objections
3.1 Using data sources that under-estimate lower tropospheric warming
Christy+McNider rely on at least three data sources: satellites, radiosondes (weather balloons), and re-analyses [1, page 511 and table 1 on page 512]. Let's examine each of these sources in turn, beginning with the satellites.
Christy+McNider use four satellite-based analyses: the latest two analyses from UAH and the latest two analyses from a group at Remote Sensing Systems (RSS) [1, table 1 on page 512]. These analyses are problematic since RSS admits that all four analyses likely under-estimate lower tropospheric warming [50, page 7715]. Figure 2 presents temperature trends from these four analyses:

Figure 2: Near-global, lower tropospheric temperature trends from 1979 - 2016 for RSS and UAH, relative to a baseline of 1979 - 1981. Depicted trends come from version 3.3 and version 4.0 of the RSS analysis, along with version 5.6 and version 6.0 of the UAH analysis. RSS version 4.0 is an update of RSS version 3.3, while UAH version 6.0 is an update of UAH version 5.6. The lower lines (black, gray, red, and pink) indicate relative temperature. The upper lines (green and purple) display the difference between the relative temperature values from different analysis versions [50, figure 9a on page 7711].
Furthermore:
- UAH has a long history of under-estimating tropospheric warming due to UAH's faulty data processing [30, from 36:31 to 37:10; 51; 52; 53, pages 5 and 6; 54 - 57; 503]
- other scientists have critiqued UAH's data processing methods [26; 56; 57; 58, pages 17 - 19; 59 - 65; 503]
- UAH's satellite-based temperature analyses often diverge from analyses made by other research groups, in both the troposphere and other atmospheric layers [26; 58, pages 17 - 19; 57; 59 - 64; 66; 520, pages S17 and S18]
Christy+McNider, as UAH scientists, conveniently avoid mentioning these issues in their paper [1]. And contrary to the claims made by the myth defender Paul Homewood [8], UAH's mistakes did not stop by 2006, since scientists continue to point out deficiencies in UAH's post-2006 analyses [26; 59; 60; 63 - 65]. A recent paper went so far as to disregard UAH's analyses, and instead focus on the RSS analysis and another satellite-based analysis from the National Oceanic and Atmospheric Administration Center for Satellite Applications and Research (NOAA/STAR) [67].
Scientists at NOAA/STAR, UAH, RSS, etc. process the satellite data in different ways. For example, scientists need to apply a diurnal drift correction to account for the fact that satellites measurements occur at different times of day [50; 54; 55; 59; 60; 343]. Since temperature at noon will likely be warmer than temperature at midnight, correcting for this time-of-day effects remains crucial for discovering any underlying tropospheric warming trends.
These corrections are known as homogenization (this is the "data processing" I referred to above); scientists also perform homogenization to correct for other factors besides diurnal drift [51; 60; 69; 70; 95]. Homogenization needs to be done; even Christy homogenizes his UAH satellite-based analysis [55; 69], contrary to the false insinuations made by the myth proponent Paul Homewood [68]. Different research groups use different methods to homogenize their satellite-based tropospheric warming analyses; these differences introduce further observational uncertainty in the resulting satellite-based estimates [51; 60; 69; 70; 71].
The UAH team's homogenization errors often border on the ridiculous. The RSS team, for instance, revealed that UAH bungled the diurnal drift homogenization in a way that spuriously reduced the resulting tropospheric warming trend. The error occurred because Christy's UAH team falsely assumed that the lower troposphere warmed at midnight and cooled at mid-day [54; 55; 503]. When Christy and his UAH colleague Spencer admitted this error [55], RSS members Mears and Wentz offered the following priceless reply:
"Clearly, the lower troposphere does not warm at night and cool in the middle of the day. We question why Christy and Spencer adopted an obviously wrong diurnal correction in the first place [55]."
Or as reportedly noted by Kevin Trenberth, one of Christy's supervisors in graduate school:
"[Trenberth] said he distanced himself from Christy around 2001, worried that every time a decision was called for in processing data, Christy was choosing values that gave little or no trend [524]."
(This quote is consistent with Trenberth's decades-long history of documenting Christy's distortions and correcting those who abused Christy's distortions in order to misleadingly minimize global warming [57; 525 - 528])
Yes, one wonders why the UAH team adopted an obviously wrong adjustment that conveniently reduced their stated amount of lower tropospheric warming...
So RSS identified a mistake in the UAH team's homogenization [55], as RSS has been doing for almost two decades [26; 50; 54 - 56; 59]. Conversely, UAH scientists pointed how an older RSS analysis under-estimate lower tropospheric warming. UAH scientist Roy Spencer further suggested that one should opt for the flawed RSS analysis over Spencer's own UAH analysis, if one was committed to showing as little global warming as possible [72]. Despite Spencer suggesting that people engage in biased selection of data sources, this situation illustrates one benefit of having multiple research groups analyzing satellite data: the more research groups means there are, the greater chance the chance that at least one group will identify any homogenization mistakes, as acknowledged in a report Christy co-authored [334, pages 14, 42, 120, and 122].
Yet Christy+McNider eschew this benefit by focusing on satellite-based lower tropospheric analyses from 2 research groups [1, page 511 and table 1 on page 512], instead of examining the mid-to-upper tropospheric analyses from 6 research groups (at RSS [26; 59; 67], NOAA/STAR [26; 61; 62; 67; 73; 74], University of Washington {UW} [26; 60], University of Maryland {UMD} [75; 76], UAH [69], and a sixth group [77]). Christy is well aware of these groups since Christy cited 5 of the 6 groups in another paper [193, page 1694] and in an article [192, table 2.2 on page S17] cited by Christy+McNider [1, page 511].
Analyses from the 5 other research groups show more mid-to-upper tropospheric warming [26; 59 - 62; 67; 69; 73 - 77] than does the UAH analysis [26; 60; 69]. This may explain why UAH scientists Christy+McNider conveniently avoid these satellite-based estimates of upper tropospheric warming, even though Christy+McNider choose to cite radiosonde-based estimates of upper tropospheric warming [1, figure 3 on page 516]. So satellite-based mid-to-upper tropospheric warming trends undermine the credibility of Christy+McNider's UAH analysis, and Christy+McNider depend on satellite-based analyses that under-estimate lower tropospheric warming.
Moving from satellites to radiosondes: for years scientists have known that radiosonde analyses contain spurious cooling in the tropical troposphere [51; 52; 58, page 19; 60; 78 - 82; 334, pages 74 and 121], as pointed out in a report that Christy co-authored [83, pages 3 and 7; 334, pages 74 and 121]. Christy commented on this cold bias before [55], so he has excuse for not being aware of it.
Christy should be aware of this cooling for another reason: over a decade ago, Christy emphasized how radiosonde analyses fit with Christy's small UAH tropospheric warming trend [84 - 87]. However, RSS researchers then showed Christy that his tropospheric warming trend was spuriously low and needed to be adjusted upwards [54; 55; 87; 503], as I discussed above. Thus Christy should be aware of the dangers on relying on spuriously cool, radiosonde-based trends. Christy+McNider, however, continue to exploit this spurious cooling in order to exaggerate the difference between models vs. radiosonde analyses [1, figure 3 on page 516].
The spuriously cool radiosonde trends likely result from changes in radiosonde equipment during the 1980s [78 - 80; 334, pages 74 and 121]. Correcting some of this spurious cooling using homogenization results in further observational uncertainty in radiosonde-based trends [51; 70; 334, pages 74 and 121]. Accounting for the spurious cooling, along with internal variability (I discuss this variability further in section 3.2), explains most of the difference between models vs. radiosonde analyses with respect to tropical tropospheric warming [81]. Similar explanations likely account for model-data differences outside of the tropics, though the differences are more pronounced in the tropics [78 - 80].
Since the post-1979 radiosonde-based warming trends remain spuriously low [81], an accurate satellite-based estimate should show greater tropospheric warming than radiosonde-based estimates. The most recent UAH analyses fail this test, as shown in figure 3 below:

Figure 3: Comparison of relative, lower tropospheric temperature trends from 1979 - 2012 for satellite-based analyses and weather-balloon-based analyses, as presented by the RSS team. The figure covers specific regions where valid weather balloon data is available for each weather balloon analysis. The satellite-based analyses are RSS version 3.3, RSS version 4.0, UAH version 5.6, and UAH version 6.0. The weather balloon analyses are Hadley Center Radiosonde Temperature (HadAT), Radiosonde Observation Correction using Reanalysis (RAOBCORE), Radiosonde Innovation Composite Homogenization (RICH), and Iterative Universal Kriging (IUK) [50, figure 12]. RSS did not include Radiosonde Atmospheric Temperature Products for Assessing Climate (RATPAC), since RATPAC lacked the homogenization needed for a valid comparison [50, page 7712].
So the radiosonde analyses do not lend credibility to the satellite-based UAH analyses, despite Christy+McNider's citation of these radiosonde analyses [1, pages 511 and 516] and despite Homewood's reference to radiosonde-based trends [8].
And so we come to the re-analyses. Re-analyses incorporate radiosonde and satellite data [88; 315; 316]. And, as with both radiosonde [78 - 81] and satellite analyses [50, page 7715], re-analyses can under-estimate lower tropospheric warming. For example, Christy+McNider rely [1, page 511], in part, on Christy's discussion of the European Centre for Medium-Range Weather Forecasts Interim re-analysis (ERA-I) [192, pages S16 and S17]. But in 2014 [88] and again in 2016 [89, section 9], the ERA-I team admitted that ERA-I under-estimates lower tropospheric warming. Other researchers also noted that ERA-I under-estimates lower tropospheric warming [148, section 2]. But Christy+McNider still cite re-analyses such as ERA-I [1, page 511]. Taken together with their citation of satellite analyses and radiosondes, it is clear that Christy+McNider rely on sources that under-estimate tropospheric warming, and thus Christy+McNider likely under-estimate climate sensitivity. In sections of 2.1 and 2.2 of "Myth: Evidence Supports Curry's Claims Regarding Satellite-based Analyses and the Hot Spot", I further discuss under-estimated tropospheric warming trends.
Christy+McNider make no mention of the fact that ERA-I under-estimates lower tropospheric warming [1, page 511]. Moreover, they emphasize tropical, radiosonde-based tropospheric warming trends, without mentioning the well-known problems with these spuriously cool trends [1, page 516]. Nor do Christy+McNider address any of the published arguments showing that satellite-based analyses under-estimate lower tropospheric warming [1]. So Christy+McNider omit published research that shows their data sources under-estimate warming; their omission may mislead Christy+McNider's audience.
(At this point, a critic might claim that "it's suspiciously convenient that satellite analyses, radiosonde analyses, and re-analyses all under-estimate lower tropopsheric warming." But this suspicion lacks merit, since climate scientists admit when observational analyses over-estimate warming [for example: 61, page 57; 70, page 1439; 90]. So there is no conspiracy to always say that warming is under-estimated. For a more detailed response to paranoid conspiracy theories about climate scientists and homogenized analyses, see the response to objection 1 in section 3.1 of "John Christy, Climate Models, and Long-term Troposoheric Warming".)
Christy+McNider rely on at least three data sources: satellites, radiosondes (weather balloons), and re-analyses [1, page 511 and table 1 on page 512]. Let's examine each of these sources in turn, beginning with the satellites.
Christy+McNider use four satellite-based analyses: the latest two analyses from UAH and the latest two analyses from a group at Remote Sensing Systems (RSS) [1, table 1 on page 512]. These analyses are problematic since RSS admits that all four analyses likely under-estimate lower tropospheric warming [50, page 7715]. Figure 2 presents temperature trends from these four analyses:
 |
Figure 2: Near-global, lower tropospheric temperature trends from 1979 - 2016 for RSS and UAH, relative to a baseline of 1979 - 1981. Depicted trends come from version 3.3 and version 4.0 of the RSS analysis, along with version 5.6 and version 6.0 of the UAH analysis. RSS version 4.0 is an update of RSS version 3.3, while UAH version 6.0 is an update of UAH version 5.6. The lower lines (black, gray, red, and pink) indicate relative temperature. The upper lines (green and purple) display the difference between the relative temperature values from different analysis versions [50, figure 9a on page 7711]. |
Furthermore:
- UAH has a long history of under-estimating tropospheric warming due to UAH's faulty data processing [30, from 36:31 to 37:10; 51; 52; 53, pages 5 and 6; 54 - 57; 503]
- other scientists have critiqued UAH's data processing methods [26; 56; 57; 58, pages 17 - 19; 59 - 65; 503]
- UAH's satellite-based temperature analyses often diverge from analyses made by other research groups, in both the troposphere and other atmospheric layers [26; 58, pages 17 - 19; 57; 59 - 64; 66; 520, pages S17 and S18]
Christy+McNider, as UAH scientists, conveniently avoid mentioning these issues in their paper [1]. And contrary to the claims made by the myth defender Paul Homewood [8], UAH's mistakes did not stop by 2006, since scientists continue to point out deficiencies in UAH's post-2006 analyses [26; 59; 60; 63 - 65]. A recent paper went so far as to disregard UAH's analyses, and instead focus on the RSS analysis and another satellite-based analysis from the National Oceanic and Atmospheric Administration Center for Satellite Applications and Research (NOAA/STAR) [67].
Scientists at NOAA/STAR, UAH, RSS, etc. process the satellite data in different ways. For example, scientists need to apply a diurnal drift correction to account for the fact that satellites measurements occur at different times of day [50; 54; 55; 59; 60; 343]. Since temperature at noon will likely be warmer than temperature at midnight, correcting for this time-of-day effects remains crucial for discovering any underlying tropospheric warming trends.
These corrections are known as homogenization (this is the "data processing" I referred to above); scientists also perform homogenization to correct for other factors besides diurnal drift [51; 60; 69; 70; 95]. Homogenization needs to be done; even Christy homogenizes his UAH satellite-based analysis [55; 69], contrary to the false insinuations made by the myth proponent Paul Homewood [68]. Different research groups use different methods to homogenize their satellite-based tropospheric warming analyses; these differences introduce further observational uncertainty in the resulting satellite-based estimates [51; 60; 69; 70; 71].
The UAH team's homogenization errors often border on the ridiculous. The RSS team, for instance, revealed that UAH bungled the diurnal drift homogenization in a way that spuriously reduced the resulting tropospheric warming trend. The error occurred because Christy's UAH team falsely assumed that the lower troposphere warmed at midnight and cooled at mid-day [54; 55; 503]. When Christy and his UAH colleague Spencer admitted this error [55], RSS members Mears and Wentz offered the following priceless reply:
"Clearly, the lower troposphere does not warm at night and cool in the middle of the day. We question why Christy and Spencer adopted an obviously wrong diurnal correction in the first place [55]."
Or as reportedly noted by Kevin Trenberth, one of Christy's supervisors in graduate school:
"[Trenberth] said he distanced himself from Christy around 2001, worried that every time a decision was called for in processing data, Christy was choosing values that gave little or no trend [524]."
(This quote is consistent with Trenberth's decades-long history of documenting Christy's distortions and correcting those who abused Christy's distortions in order to misleadingly minimize global warming [57; 525 - 528])
Yes, one wonders why the UAH team adopted an obviously wrong adjustment that conveniently reduced their stated amount of lower tropospheric warming...
So RSS identified a mistake in the UAH team's homogenization [55], as RSS has been doing for almost two decades [26; 50; 54 - 56; 59]. Conversely, UAH scientists pointed how an older RSS analysis under-estimate lower tropospheric warming. UAH scientist Roy Spencer further suggested that one should opt for the flawed RSS analysis over Spencer's own UAH analysis, if one was committed to showing as little global warming as possible [72]. Despite Spencer suggesting that people engage in biased selection of data sources, this situation illustrates one benefit of having multiple research groups analyzing satellite data: the more research groups means there are, the greater chance the chance that at least one group will identify any homogenization mistakes, as acknowledged in a report Christy co-authored [334, pages 14, 42, 120, and 122].
Yet Christy+McNider eschew this benefit by focusing on satellite-based lower tropospheric analyses from 2 research groups [1, page 511 and table 1 on page 512], instead of examining the mid-to-upper tropospheric analyses from 6 research groups (at RSS [26; 59; 67], NOAA/STAR [26; 61; 62; 67; 73; 74], University of Washington {UW} [26; 60], University of Maryland {UMD} [75; 76], UAH [69], and a sixth group [77]). Christy is well aware of these groups since Christy cited 5 of the 6 groups in another paper [193, page 1694] and in an article [192, table 2.2 on page S17] cited by Christy+McNider [1, page 511].
Analyses from the 5 other research groups show more mid-to-upper tropospheric warming [26; 59 - 62; 67; 69; 73 - 77] than does the UAH analysis [26; 60; 69]. This may explain why UAH scientists Christy+McNider conveniently avoid these satellite-based estimates of upper tropospheric warming, even though Christy+McNider choose to cite radiosonde-based estimates of upper tropospheric warming [1, figure 3 on page 516]. So satellite-based mid-to-upper tropospheric warming trends undermine the credibility of Christy+McNider's UAH analysis, and Christy+McNider depend on satellite-based analyses that under-estimate lower tropospheric warming.
Moving from satellites to radiosondes: for years scientists have known that radiosonde analyses contain spurious cooling in the tropical troposphere [51; 52; 58, page 19; 60; 78 - 82; 334, pages 74 and 121], as pointed out in a report that Christy co-authored [83, pages 3 and 7; 334, pages 74 and 121]. Christy commented on this cold bias before [55], so he has excuse for not being aware of it.
Christy should be aware of this cooling for another reason: over a decade ago, Christy emphasized how radiosonde analyses fit with Christy's small UAH tropospheric warming trend [84 - 87]. However, RSS researchers then showed Christy that his tropospheric warming trend was spuriously low and needed to be adjusted upwards [54; 55; 87; 503], as I discussed above. Thus Christy should be aware of the dangers on relying on spuriously cool, radiosonde-based trends. Christy+McNider, however, continue to exploit this spurious cooling in order to exaggerate the difference between models vs. radiosonde analyses [1, figure 3 on page 516].
The spuriously cool radiosonde trends likely result from changes in radiosonde equipment during the 1980s [78 - 80; 334, pages 74 and 121]. Correcting some of this spurious cooling using homogenization results in further observational uncertainty in radiosonde-based trends [51; 70; 334, pages 74 and 121]. Accounting for the spurious cooling, along with internal variability (I discuss this variability further in section 3.2), explains most of the difference between models vs. radiosonde analyses with respect to tropical tropospheric warming [81]. Similar explanations likely account for model-data differences outside of the tropics, though the differences are more pronounced in the tropics [78 - 80].
Since the post-1979 radiosonde-based warming trends remain spuriously low [81], an accurate satellite-based estimate should show greater tropospheric warming than radiosonde-based estimates. The most recent UAH analyses fail this test, as shown in figure 3 below:
|
Figure 3: Comparison of relative, lower tropospheric temperature trends from 1979 - 2012 for satellite-based analyses and weather-balloon-based analyses, as presented by the RSS team. The figure covers specific regions where valid weather balloon data is available for each weather balloon analysis. The satellite-based analyses are RSS version 3.3, RSS version 4.0, UAH version 5.6, and UAH version 6.0. The weather balloon analyses are Hadley Center Radiosonde Temperature (HadAT), Radiosonde Observation Correction using Reanalysis (RAOBCORE), Radiosonde Innovation Composite Homogenization (RICH), and Iterative Universal Kriging (IUK) [50, figure 12]. RSS did not include Radiosonde Atmospheric Temperature Products for Assessing Climate (RATPAC), since RATPAC lacked the homogenization needed for a valid comparison [50, page 7712]. |
So the radiosonde analyses do not lend credibility to the satellite-based UAH analyses, despite Christy+McNider's citation of these radiosonde analyses [1, pages 511 and 516] and despite Homewood's reference to radiosonde-based trends [8].
And so we come to the re-analyses. Re-analyses incorporate radiosonde and satellite data [88; 315; 316]. And, as with both radiosonde [78 - 81] and satellite analyses [50, page 7715], re-analyses can under-estimate lower tropospheric warming. For example, Christy+McNider rely [1, page 511], in part, on Christy's discussion of the European Centre for Medium-Range Weather Forecasts Interim re-analysis (ERA-I) [192, pages S16 and S17]. But in 2014 [88] and again in 2016 [89, section 9], the ERA-I team admitted that ERA-I under-estimates lower tropospheric warming. Other researchers also noted that ERA-I under-estimates lower tropospheric warming [148, section 2]. But Christy+McNider still cite re-analyses such as ERA-I [1, page 511]. Taken together with their citation of satellite analyses and radiosondes, it is clear that Christy+McNider rely on sources that under-estimate tropospheric warming, and thus Christy+McNider likely under-estimate climate sensitivity. In sections of 2.1 and 2.2 of "Myth: Evidence Supports Curry's Claims Regarding Satellite-based Analyses and the Hot Spot", I further discuss under-estimated tropospheric warming trends.
Christy+McNider make no mention of the fact that ERA-I under-estimates lower tropospheric warming [1, page 511]. Moreover, they emphasize tropical, radiosonde-based tropospheric warming trends, without mentioning the well-known problems with these spuriously cool trends [1, page 516]. Nor do Christy+McNider address any of the published arguments showing that satellite-based analyses under-estimate lower tropospheric warming [1]. So Christy+McNider omit published research that shows their data sources under-estimate warming; their omission may mislead Christy+McNider's audience.
(At this point, a critic might claim that "it's suspiciously convenient that satellite analyses, radiosonde analyses, and re-analyses all under-estimate lower tropopsheric warming." But this suspicion lacks merit, since climate scientists admit when observational analyses over-estimate warming [for example: 61, page 57; 70, page 1439; 90]. So there is no conspiracy to always say that warming is under-estimated. For a more detailed response to paranoid conspiracy theories about climate scientists and homogenized analyses, see the response to objection 1 in section 3.1 of "John Christy, Climate Models, and Long-term Troposoheric Warming".)
3.2 Inadequately addressing alternative explanations for discrepancies between models and observational analyses
Christy+McNider suggest that climate models over-estimate climate sensitivity, and that this may explain why UAH's tropospheric warming trend differs from model-based projections of this trend [1]. Christy+McNider, however, admit that they cannot fully discount other explanations of the discrepancy between the UAH-based trend and model-based projections [1, page 517]. I discuss these alternative explanations in section 2.1 of "Myth: Santer et al. Show that Climate Models are Very Flawed"; the following thought experiment illustrates these alternative explanations.
Suppose you have a model for coin flips. If you input information into the model, then as output the model predicts the number of heads and tails for a given number of coin flips. So you input information about how you flipped a fair coin 40 times. The model predicts 20 heads and 20 tails. In reality, you observed 12 heads and 28 tails; thus the model's output is not the same as your data. This discrepancy could be due to a number of reasons, including that:
- your data is flawed or uncertain (ex: because you miscounted the number of heads)
- your input is flawed or uncertain (ex: you input that the coin is fair, even though the coin is loaded to one side and thus not fair)
- variability / chance (ex: the smaller your sample size of coin flips, the greater the chance that you will get ratios very far off from 1-to-1 ratio of heads-to-tails)
- your model is flawed (ex: your model contains inaccurate information about the motion of coins)
These reasons are not mutually exclusive, since all four of these explanations could simultaneously contribute to the discrepancy between your data and your model's output. Furthermore, the first three explanations are compatible with your model being perfect; only explanation 4 implies a flaw in your model.
One can apply this same reasoning to discrepancies between data on global warming vs. climate models' projections of this data. Thus one can explain these discrepancies via the following explanations that correspond to the 4 coin flip explanations listed above:
- A1 : the data is flawed or uncertain [26; 51; 58; 60; 63 - 65; 70; 78 - 81; 83; 91, page 478; 92 - 100]
- A2 : the inputs for volcanic factors, solar factors, etc. are flawed or uncertain [26, page 379; 58, page 27; 91, pages 478 and 483; 92, page 4; 93; 94; 100; 234]
- A3 : internal variability / chance [26; 51; 92; 94; 101, page 194; 102 - 107; 327]
- A4 : the climate models are flawed [1; 26, page 379; 92, page 4; 93; 108; 109]
As with the 4 coin flip explanations, explanations A1 to A4 are not mutually exclusive [92, page 4], and only A4 implies a flaw in the climate models [26, page 379; 91, page 480; 92, pages 3 and 4; 234, page 188].
Observational uncertainty (explanation A1) [102; 110; 111], forcing errors (explanation A2) [111 - 113], and internal variability (explanation A3) [103; 111; 113; 114] account for much of the difference between surface warming data and climate model projections of this warming. Since surface warming often rises to the troposphere, especially in the tropics [25, page 4; 26, page 27; 29; 31; 32; 115] (as I discuss in "Myth: The Tropospheric Hot Spot does not Exist"), explaining model-data differences for surface warming also helps account for model-data differences for tropospheric warming.
For instance, a recent paper argued that once sea surface warming is accounted for, a particular climate model (the Whole Atmosphere Community Climate Model, a.k.a. WACCM) performed fairly well in representing tropospheric warming [67]. Three other papers supported a similar conclusion with respect to other climate models [198, sections 4 and 5; 323; 324, figure 1]. Consistent with these results, another paper argued that, based on the UW and NOAA/STAR satellite-based analyses, climate models accurately represent the ratio of surface warming to mid-to-upper tropospheric warming in the tropics [60]. The most recent RSS analysis [59] supports the same conclusion, by showing mid-to-upper tropical tropospheric warming on par with the NOAA/STAR analysis [26; 67].
Research has also shown that observational uncertainty [26; 51; 52; 58, page 19; 60; 78 - 82], forcing errors [91], and internal variability [81; 327] explain much of the discrepancy between observed tropospheric warming and model-based projections of this warming. I discussed some of the evidence on observational uncertainty in section 3.1. Christy+McNider admit that they cannot totally discount forcing errors and internal variability as explanations (explanations A2 and A3, respectively):
"As noted, we cannot totally discount that natural variability or errors in forcing might also account for the discrepancy between modeled and observed [tropospheric TCR] [1, page 517]."
Yet Christy+McNider still leap to the model error explanation A4 [1, page 517]. In contrast to other researchers [103; 110 - 112; 429], Christy+McNider do not use updated estimates of forcings [517], which conveniently allows them to exaggerate differences between model-based projections vs. observational analyses. Climate scientists, including Ben Santer, criticized Christy for repeatedly leaping to explanation A4 without paying sufficient attention to the other explanations [26; 91, pages 482 and 483; 92; 234], as I discuss in sections 2.3 and 2.4 of "Myth: Santer et al. Show that Climate Models are Very Flawed". Moreover, a recent paper, co-authored by Santer, argued against Christy's "models over-estimate climate sensitivity" explanation for tropospheric warming discrepancies [91, pages 482 and 483]. Santer's published research [26; 91, pages 482 and 483; 234] therefore conflicts with Christy+McNider's paper, contrary to the claims made by the myth proponent Paul Homewood. And consistent with Santer's critique of Christy's work [26; 91, pages 482 and 483; 92; 234], Christy+McNider fail to adequately address alternative explanations that would not imply that climate models over-estimate climate sensitivity.
Christy+McNider suggest that climate models over-estimate climate sensitivity, and that this may explain why UAH's tropospheric warming trend differs from model-based projections of this trend [1]. Christy+McNider, however, admit that they cannot fully discount other explanations of the discrepancy between the UAH-based trend and model-based projections [1, page 517]. I discuss these alternative explanations in section 2.1 of "Myth: Santer et al. Show that Climate Models are Very Flawed"; the following thought experiment illustrates these alternative explanations.
Suppose you have a model for coin flips. If you input information into the model, then as output the model predicts the number of heads and tails for a given number of coin flips. So you input information about how you flipped a fair coin 40 times. The model predicts 20 heads and 20 tails. In reality, you observed 12 heads and 28 tails; thus the model's output is not the same as your data. This discrepancy could be due to a number of reasons, including that:
- your data is flawed or uncertain (ex: because you miscounted the number of heads)
- your input is flawed or uncertain (ex: you input that the coin is fair, even though the coin is loaded to one side and thus not fair)
- variability / chance (ex: the smaller your sample size of coin flips, the greater the chance that you will get ratios very far off from 1-to-1 ratio of heads-to-tails)
- your model is flawed (ex: your model contains inaccurate information about the motion of coins)
These reasons are not mutually exclusive, since all four of these explanations could simultaneously contribute to the discrepancy between your data and your model's output. Furthermore, the first three explanations are compatible with your model being perfect; only explanation 4 implies a flaw in your model.
One can apply this same reasoning to discrepancies between data on global warming vs. climate models' projections of this data. Thus one can explain these discrepancies via the following explanations that correspond to the 4 coin flip explanations listed above:
- A1 : the data is flawed or uncertain [26; 51; 58; 60; 63 - 65; 70; 78 - 81; 83; 91, page 478; 92 - 100]
- A2 : the inputs for volcanic factors, solar factors, etc. are flawed or uncertain [26, page 379; 58, page 27; 91, pages 478 and 483; 92, page 4; 93; 94; 100; 234]
- A3 : internal variability / chance [26; 51; 92; 94; 101, page 194; 102 - 107; 327]
- A4 : the climate models are flawed [1; 26, page 379; 92, page 4; 93; 108; 109]
Observational uncertainty (explanation A1) [102; 110; 111], forcing errors (explanation A2) [111 - 113], and internal variability (explanation A3) [103; 111; 113; 114] account for much of the difference between surface warming data and climate model projections of this warming. Since surface warming often rises to the troposphere, especially in the tropics [25, page 4; 26, page 27; 29; 31; 32; 115] (as I discuss in "Myth: The Tropospheric Hot Spot does not Exist"), explaining model-data differences for surface warming also helps account for model-data differences for tropospheric warming.
For instance, a recent paper argued that once sea surface warming is accounted for, a particular climate model (the Whole Atmosphere Community Climate Model, a.k.a. WACCM) performed fairly well in representing tropospheric warming [67]. Three other papers supported a similar conclusion with respect to other climate models [198, sections 4 and 5; 323; 324, figure 1]. Consistent with these results, another paper argued that, based on the UW and NOAA/STAR satellite-based analyses, climate models accurately represent the ratio of surface warming to mid-to-upper tropospheric warming in the tropics [60]. The most recent RSS analysis [59] supports the same conclusion, by showing mid-to-upper tropical tropospheric warming on par with the NOAA/STAR analysis [26; 67].
Research has also shown that observational uncertainty [26; 51; 52; 58, page 19; 60; 78 - 82], forcing errors [91], and internal variability [81; 327] explain much of the discrepancy between observed tropospheric warming and model-based projections of this warming. I discussed some of the evidence on observational uncertainty in section 3.1. Christy+McNider admit that they cannot totally discount forcing errors and internal variability as explanations (explanations A2 and A3, respectively):
"As noted, we cannot totally discount that natural variability or errors in forcing might also account for the discrepancy between modeled and observed [tropospheric TCR] [1, page 517]."
Yet Christy+McNider still leap to the model error explanation A4 [1, page 517]. In contrast to other researchers [103; 110 - 112; 429], Christy+McNider do not use updated estimates of forcings [517], which conveniently allows them to exaggerate differences between model-based projections vs. observational analyses. Climate scientists, including Ben Santer, criticized Christy for repeatedly leaping to explanation A4 without paying sufficient attention to the other explanations [26; 91, pages 482 and 483; 92; 234], as I discuss in sections 2.3 and 2.4 of "Myth: Santer et al. Show that Climate Models are Very Flawed". Moreover, a recent paper, co-authored by Santer, argued against Christy's "models over-estimate climate sensitivity" explanation for tropospheric warming discrepancies [91, pages 482 and 483]. Santer's published research [26; 91, pages 482 and 483; 234] therefore conflicts with Christy+McNider's paper, contrary to the claims made by the myth proponent Paul Homewood. And consistent with Santer's critique of Christy's work [26; 91, pages 482 and 483; 92; 234], Christy+McNider fail to adequately address alternative explanations that would not imply that climate models over-estimate climate sensitivity.
3.3 Conflicting with evidence on feedbacks that augment or limit climate sensitivity
Christy+McNider explain their low climate sensitivity estimate, in part, by stating that climate models may over-estimate positive feedbacks that increase climate sensitivity and/or under-estimate negative feedbacks that limit climate sensitivity [1, pages 516 and 517]. Model-based estimates of climate sensitivity primarily depend on the following feedbacks [36; 148, section 1; 339; 367]:
- Water vapor as a positive feedback: Warming evaporates liquid water to form water vapor. This increases water vapor levels in the air [27; 31; 116 - 118; 365], because warmer air can hold more water vapor [36; 119; 120; 148, section 1; 360; 365]. More water vapor causes further warming, since water vapor is a greenhouse gas [33; 36; 117; 121 - 123; 365].
- Clouds as a positive feedback: Clouds reflect solar radiation into space and thus act as a negative feedback; clouds also reflect/absorb radiation emitted by the Earth and thus act as a positive feedback [119; 124; 125]. Lower level clouds tend to act as a negative feedback, while higher level clouds tend to act as a positive feedback [119; 124 - 126; 148]. Climate models predict a net positive feedback from clouds due to increases in higher level clouds and reductions in lower level clouds in response to warming [124; 127].
- Surface albedo as a positive feedback: Ice has a greater albedo than liquid water, meaning that ice reflects more visible light from the Sun back into space than does liquid water. Melting ice therefore reduces Earth's albedo and increases the amount of radiation absorbed by Earth's surface [2; 4; 148]. This increase in absorbed radiation causes more surface warming and therefore more ice melt; thus melting ice acts as a positive feedback amplifying warming [128 - 131; 339].
- Lapse rate reduction as a negative feedback: Tropospheric temperature decreases with increasing height; the rate of decrease is known as the tropospheric lapse rate. The magnitude of the lapse rate decreases when the upper troposphere warms faster than the lower troposphere, and when the lower troposphere warms faster than the surface. Transferring warming from the surface to the troposphere thus reduces the lapse rate [25, pages 4 and 22; 26 - 29; 30, from 31:01 to 31:48; 31 - 33; 34, pages 7 and 8; 35, pages 101 and 102] and allows Earth to more easily radiate this energy into space. So lapse rate reduction limits global warming [31 - 33; 36; 132 - 134; 148; 326, section 2.6.1 on pages 89 - 90; 332, figure 3c on page 5 and page 16; 333; 339; 426]. In contrast to the tropics, within the Arctic the surface warms faster than the lower troposphere and the lower troposphere warms faster than the upper troposphere [30, from 29:38 to 31:01; 34; 35; 51; 121, page 445; 392 - 397; 398, page 375; 426], leading to a lapse rate increase and a positive lapse rate feedback in the Arctic [339; 352; 392; 399 - 405; 426].
- Planck feedback as a negative feedback: As Earth warms, Earth radiates more energy into space, as per the Stefan-Boltzmann law. This increased radiation represents the Planck feedback and serves as a negative feedback that limits the amount of energy Earth accumulates as Earth warms [36; 326, section 2.6.1 on pages 89 - 90; 351 - 353].
I discuss these feedbacks further in section 2.2 of "Myth: Attributing Warming to CO2 Involves the Fallaciously Inferring Causation from a Mere Correlation" and in "Myth: No Hot Spot Implies Less Global Warming and Support for Lukewarmerism". Figure 4 below estimates how much each of these feedbacks contributes to model-based estimates of climate sensitivity:

Figure 4: (a) Average equilibrium temperature change (ECS) in response to a doubling of atmospheric CO2 levels in atmosphere-ocean general circulation models (GCMs) from CMIP3 (phase 3 of the Coupled Model Intercomparison Project), and the contribution of various feedbacks to this temperature change in the CMIP3 models. The Planck response represents temperature response to forcing from CO2, without taking other feedbacks into account [36; 326, section 2.6.1 on page 89 - 90]. (b) Average relative magnitude of each feedback in the CMIP3 models, with stronger positive feedbacks having a more positive value and stronger negative feedbacks having a more negative value. Error bars indicate +/- one standard deviation [36; also see 367, figure 1].
Christy+McNider explain their low climate sensitivity estimate, in part, by stating that climate models may over-estimate positive feedbacks that increase climate sensitivity and/or under-estimate negative feedbacks that limit climate sensitivity [1, pages 516 and 517]. Model-based estimates of climate sensitivity primarily depend on the following feedbacks [36; 148, section 1; 339; 367]:
- Water vapor as a positive feedback: Warming evaporates liquid water to form water vapor. This increases water vapor levels in the air [27; 31; 116 - 118; 365], because warmer air can hold more water vapor [36; 119; 120; 148, section 1; 360; 365]. More water vapor causes further warming, since water vapor is a greenhouse gas [33; 36; 117; 121 - 123; 365].
- Clouds as a positive feedback: Clouds reflect solar radiation into space and thus act as a negative feedback; clouds also reflect/absorb radiation emitted by the Earth and thus act as a positive feedback [119; 124; 125]. Lower level clouds tend to act as a negative feedback, while higher level clouds tend to act as a positive feedback [119; 124 - 126; 148]. Climate models predict a net positive feedback from clouds due to increases in higher level clouds and reductions in lower level clouds in response to warming [124; 127].
- Surface albedo as a positive feedback: Ice has a greater albedo than liquid water, meaning that ice reflects more visible light from the Sun back into space than does liquid water. Melting ice therefore reduces Earth's albedo and increases the amount of radiation absorbed by Earth's surface [2; 4; 148]. This increase in absorbed radiation causes more surface warming and therefore more ice melt; thus melting ice acts as a positive feedback amplifying warming [128 - 131; 339].
- Lapse rate reduction as a negative feedback: Tropospheric temperature decreases with increasing height; the rate of decrease is known as the tropospheric lapse rate. The magnitude of the lapse rate decreases when the upper troposphere warms faster than the lower troposphere, and when the lower troposphere warms faster than the surface. Transferring warming from the surface to the troposphere thus reduces the lapse rate [25, pages 4 and 22; 26 - 29; 30, from 31:01 to 31:48; 31 - 33; 34, pages 7 and 8; 35, pages 101 and 102] and allows Earth to more easily radiate this energy into space. So lapse rate reduction limits global warming [31 - 33; 36; 132 - 134; 148; 326, section 2.6.1 on pages 89 - 90; 332, figure 3c on page 5 and page 16; 333; 339; 426]. In contrast to the tropics, within the Arctic the surface warms faster than the lower troposphere and the lower troposphere warms faster than the upper troposphere [30, from 29:38 to 31:01; 34; 35; 51; 121, page 445; 392 - 397; 398, page 375; 426], leading to a lapse rate increase and a positive lapse rate feedback in the Arctic [339; 352; 392; 399 - 405; 426].
- Planck feedback as a negative feedback: As Earth warms, Earth radiates more energy into space, as per the Stefan-Boltzmann law. This increased radiation represents the Planck feedback and serves as a negative feedback that limits the amount of energy Earth accumulates as Earth warms [36; 326, section 2.6.1 on pages 89 - 90; 351 - 353].
I discuss these feedbacks further in section 2.2 of "Myth: Attributing Warming to CO2 Involves the Fallaciously Inferring Causation from a Mere Correlation" and in "Myth: No Hot Spot Implies Less Global Warming and Support for Lukewarmerism". Figure 4 below estimates how much each of these feedbacks contributes to model-based estimates of climate sensitivity:
 |
Figure 4: (a) Average equilibrium temperature change (ECS) in response to a doubling of atmospheric CO2 levels in atmosphere-ocean general circulation models (GCMs) from CMIP3 (phase 3 of the Coupled Model Intercomparison Project), and the contribution of various feedbacks to this temperature change in the CMIP3 models. The Planck response represents temperature response to forcing from CO2, without taking other feedbacks into account [36; 326, section 2.6.1 on page 89 - 90]. (b) Average relative magnitude of each feedback in the CMIP3 models, with stronger positive feedbacks having a more positive value and stronger negative feedbacks having a more negative value. Error bars indicate +/- one standard deviation [36; also see 367, figure 1]. |
In accordance with the Planck feedback, Earth releases more radiation during the warm El Niño phase of an ocean cycle known as the El Niño-Southern Oscillation (ENSO) [223 - 225]; the radiation increase occurs largely because El Niño increases cloud cover and these clouds then reflect the solar radiation Earth would otherwise absorb [223; 226]. This cloud-based mechanism compensates [223; 225] for less emission of radiation by clouds during El Niño [227; 228]. Thus Earth radiates more energy into space as Earth warms [120; 221; 222].
Scientific evidence revealed that water vapor [133; 135 - 140; 148; 331; 335; 425], clouds [126; 127; 133; 141 - 148; 430], and reduced surface albedo [128 - 130; 133; 149 - 151] acted as positive feedbacks amplifying global warming. And in the tropics, the mid-to-upper troposphere warmed more than near the surface, as shown in satellite analyses [26, figure 9B on page 385; 60, table 4 on page 2285; 75; 77], radiosonde analyses [81, figure 2c; 198, figure 9; 199, figures 1 and 2], re-analyses [88, figure 23 on page 348 and section 10.2.2 on page 351; 152, figure 7; 153, figure 1; 154, figure 4; 155, figure 4], and other sources [200; 347, as cited in 348, page 651]. This tropospheric hot spot indicates that the tropical lapse rate decreased (I discuss this further in "Myth: The Tropospheric Hot Spot does not Exist"). Lapse rate reduction acted as a negative feedback limiting global warming [31; 133; 148; 332, figure 3c on page 5 and page 16; 333]. The Arctic near-surface also warmed faster than the Arctic upper troposphere [30, from 29:38 to 31:01; 128; 406; 407; 408 - 413, generated using 387, as per 388], indicative of a positive lapse rate feedback [339; 352; 392; 399 - 405; 426]. The processes underlying this positive lapse rate feedback contribute [392; 399; 400; 405; 426] to strong surface warming in the Arctic [128; 406; 382; 414; 415 - 421, generated using 387, as per 388], resulting in greater surface warming in the Arctic than in the tropics and than the global average [30, from 29:38 to 31:01, and 31:47 to 33:34; 198; 199; 382; 414; 415 - 421, generated using 387, as per 388; 422 - 424], consistent with climate models and basic physical theory [30, from 29:38 to 31:01, and 31:47 to 33:34; 34; 35; 51; 352; 393; 395; 397; 398, page 375; 426].
Despite this evidence confirming the negative and positive feedbacks depicted in climate models, Christy+McNider still suggest that climate models over-estimate the positives feedbacks and/or over-estimate the negative feedbacks [1, pages 516 and 517]. They defend their suggestion in a number of misleading ways.
For example, in order to explain why climate models may distort feedbacks, Christy+McNider focus on differences between model-based projections and radiosonde-based analyses in the tropical troposphere [1, pages 516 and 517]. But as I discussed in section 3.1, Christy+McNider do this without addressing any of the published evidence showing that radiosonde-based analyses under-estimate tropical tropospheric warming [78 - 80]. So Christy+McNider's feedback discussion relies on ignoring well-known flaws in published data analyses.
Christy+McNider also distort the scientific literature in a number ways. They, for instance, generate uncertainty about man-made, CO2-induced warming [1, page 516] by citing a 2010 paper from their UAH colleague Roy Spencer [156]. They also cite [1, page 516] a 2011 paper from Choi and Lindzen [157]. However, Christy+McNider fail to mention the withering rebuttals of Lindzen's 2011 paper [107, page 1375; 158; 344], and the rebuttals of Spencer's attempt [159] to apply his 2010 work to climate feedbacks [107, page 1375; 148, section 1].
Christy+McNider are not alone in their misleading, and selective, citation the peer-reviewed literature; Christopher Monckton, and his co-authors Willie Soon, David Legates, and William Briggs, also engage in this selective citation:
"For instance, [Monckton et al.] cite [Spencer RW, Braswell WD 2011], which was shown to have made four errors which invalidated the conclusions [...]. Another example is [Lindzen RS, Choi Y-S 2011] which was a follow-on from [Lindzen RS, Choi Y-S 2009] and was collectively rebutted by five separate publications [...]) [107, page 1375]."
In keeping with their misleading citation of the scientific literature, Christy+McNider cite a 2007 IPCC report in order to show that the magnitude of cloud feedbacks are not fairly well-known [1, page 516]. Christy+McNider also suggest that cloud feedback and water vapor feedback cannot be clearly assessed for the period from the late 1970s to the early 1990s [1, page 515]. Yet they do not mention published evidence on positive feedback from clouds [126; 127; 133; 141 - 148] and water vapor [133; 135 - 140; 148; 364; 425]. This allows Christy+McNider to exaggerate uncertainty about cloud and water vapor feedbacks, by evading post-2007 research that improved scientists' knowledge of these feedbacks [126; 127; 133; 135; 136; 139 - 148; 160; 161; 364].
Christy+McNider then suggest that climate models may over-estimate water vapor levels in the atmosphere, leading to the models over-estimating warming [1, pages 516 - 517; 9]. But Christy+McNider conveniently evade published evidence of atmospheric water levels increasing in conjunction with warming [31; 135; 139; 148; 162 - 164; 365], an important sign of positive water vapor feedback [135; 139; 148]. Moreover, Christy+McNider suggest that models distort the water cycle, contributing to model error with respect to tropospheric warming [1, pages 511 and 516 - 517]; Christy makes similar claims elsewhere [361, section 5].
But Christy+McNider's suggestion may lack merit, since models made fairly accurate predictions about the water cycle [360; 375; 502] and precipitation patterns [362; 373; 374; 376; 380]. The models also do fairly well in representing the latent heat release by condensing water vapor that causes the lapse rate feedback, as reflected in the ratio of mid-to-upper tropical tropospheric warming vs. tropical near-surface warming. I discuss this more in section 2.2 of "Myth: Santer et al. Show that Climate Models are Very Flawed". Taken together, the aforementioned points show that Christy+McNider distort the state of the science on water vapor and cloud feedbacks.
Christy+McNider also mention that, on their analysis, climate models over-estimate the lapse rate feedback [1, pages 511 and 516]. All other things being equal, this would imply that models under-estimate climate sensitivity, since the lapse rate feedback is a negative feedback that mitigates climate sensitivity [31 - 33; 36; 132 - 134; 148]. Christy knows this [1, pages 511 and 516; 370; 371], especially after the climate scientist Michael Mann pointed it out to him [427, page 103]. Yet Christy+McNider fail to address this point. So Christy+McNider would need to explain how the climate models could both over-estimate this negative feedback that limits climate sensitivity, while also over-estimating climate sensitivity.
Christy+McNider do address how "latent heat releas[e]" causes the lapse rate feedback, with increased warming higher in the troposphere [1, page 516]. However, as I discussed in section 3.1, Christy+McNider avoid addressing evidence of lapse rate reduction in the form of greater tropical warming in the mid-to-upper troposphere than near Earth's surface [26, figure 9B on page 385; 60, table 4 on page 2285; 75; 77; 81, figure 2c; 88, figure 23 on page 348 and section 10.2.2 on page 351; 152, figure 7; 153, figure 1; 154, figure 4; 155, figure 4; 198, figure 9; 199, figures 1 and 2; 200]. So Christy+McNider mislead their audience regarding the lapse rate feedback.
3.4 Generating a climate sensitivity estimate that is less reliable than estimates from other sources
Christy+McNider's climate sensitivity estimate remains an outlier, since their estimate is lower than other estimates based on different sources, including surface temperature from the past ~200 years and data on climate in the distant past [3; 24, figure 10.20 of page 925]. Figure 1 in section 2 presented some older sensitivity estimates discussed by the IPCC, with a central TCR estimate of ~1.8K and a range between 1K to 2.5K [24, page 871 and figure 10.20 of page 925]. Figure 5 below depicts a more recent review of TCR estimates:

Figure 5: Recent published estimates of TCR (transient climate response). Horizontal bars show the probability range and the circles mark the median estimate [3].
Christy+McNider's tropospheric TCR estimate of 1.10K +/- 0.26K [1, page 511] translates into a surface TCR estimate of 0.93K +/- 0.22K, based on a calculation offered by Christy+McNider [1, page 515]. One could push Christy+McNider's estimate further below this range, if one opted for two other calculations offered by Christy+McNider [1, page 515]. Christy+McNider's 0.93K +/- 0.22K estimate lies on the low end of published estimates (see figure 5), and thus represents a low, though not unprecedented, outlier in the scientific literature.
So is there reason to think that Christy+McNider sensitivity estimate is credible, even though it is an outlier? Not really. In sections 3.1, 3.2, 3.3, and 3.6, I discuss problems with their tropospheric-warming-based estimate. This may explain why other scientists have not estimated climate sensitivity using satellite-based lower tropospheric warming trends; as Christy+McNider admit, their tropospheric TCR metric is new [1, page 511]. So, contrary to the claims of the myth advocate Paul Homewood [8], Christy+McNider climate sensitivity estimate is not simply a natural extension of concepts widely accepted in mainstream climate science.
One might attempt to defend Christy+McNider's estimate by citing other low estimates of climate sensitivity, such as Loehle 2014 from figure 5 above. Of course, that amounts to unjustified cherry-picking that excludes high sensitivity estimates [2; 3; 7; 103; 146; 165 - 179; 304; 317; 318; 346]. Competent scientists need not engage in unjustified cherry-picking of lower or higher estimates. Instead scientists reveal serious flaws in low sensitivity studies [3, page 3; 107, page 1375; 134; 166; 167; 169 - 173; 180; 317; 336; 372]. Correcting these flaws tends to increase the corresponding climate sensitivity estimates [3, page 3; 107; 134; 166; 167; 169 - 173; 180; 336; 372], which provides a clear justification for rejecting these low sensitivity studies. So these low sensitivity estimates fail to lend much credibility to Christy+McNider's low estimate of climate sensitivity.
Christy+McNider reply to high estimates by pointing out uncertainties and problems with the surface temperature record. They suggest these problems may bias climate sensitivity estimates that are based on surface temperature records [1, pages 511 and 514]. However, scientists already addressed the issues mentioned by Christy+McNider; for instance, scientist accounted for the effect of land use changes or urbanization [for example: 181 - 187], as I discuss in "Myth: No Hot Spot Implies Less Global Warming and Support for Lukewarmerism" and in section 3.5 of "Christopher Monckton and Projecting Future Global Warming, Part 1".
Furthermore, Christy+McNider do not address much of the research quantifying the uncertainty in the surface temperature record [for example: 188 - 191]. Nor do they show that the uncertainties for the surface temperature record are greater than the uncertainties for the tropospheric temperature records used by Christy+McNider [1, table 1 on page 512]. The satellite-based tropospheric temperature record [50] comes with greater uncertainty than the surface temperature record, as noted by RSS' Carl Mears [71, from 1:37 to 2:32; 325; 521] (based on his published uncertainty estimates [337; 338] and conference abstract [358]) and contrary to the insinuations made by the myth advocate Paul Homewood [8]; I discussed some of the sources of this tropospheric warming uncertainty in section 3.1. The U.S. Global Change Research Program makes much the same point [326, Appendix A on pages 432 - 433], as does the climate scientist Andrew Dessler [503]: satellite-based trends are likely less reliable and less certain than surface-based trends. This uncertainty further decreases the credibility of Christy+McNider's climate sensitivity estimate relative to sensitivity estimates from surface temperature records.
Christy+McNider's climate sensitivity estimate remains an outlier, since their estimate is lower than other estimates based on different sources, including surface temperature from the past ~200 years and data on climate in the distant past [3; 24, figure 10.20 of page 925]. Figure 1 in section 2 presented some older sensitivity estimates discussed by the IPCC, with a central TCR estimate of ~1.8K and a range between 1K to 2.5K [24, page 871 and figure 10.20 of page 925]. Figure 5 below depicts a more recent review of TCR estimates:
|
Figure 5: Recent published estimates of TCR (transient climate response). Horizontal bars show the probability range and the circles mark the median estimate [3]. |
Christy+McNider's tropospheric TCR estimate of 1.10K +/- 0.26K [1, page 511] translates into a surface TCR estimate of 0.93K +/- 0.22K, based on a calculation offered by Christy+McNider [1, page 515]. One could push Christy+McNider's estimate further below this range, if one opted for two other calculations offered by Christy+McNider [1, page 515]. Christy+McNider's 0.93K +/- 0.22K estimate lies on the low end of published estimates (see figure 5), and thus represents a low, though not unprecedented, outlier in the scientific literature.
So is there reason to think that Christy+McNider sensitivity estimate is credible, even though it is an outlier? Not really. In sections 3.1, 3.2, 3.3, and 3.6, I discuss problems with their tropospheric-warming-based estimate. This may explain why other scientists have not estimated climate sensitivity using satellite-based lower tropospheric warming trends; as Christy+McNider admit, their tropospheric TCR metric is new [1, page 511]. So, contrary to the claims of the myth advocate Paul Homewood [8], Christy+McNider climate sensitivity estimate is not simply a natural extension of concepts widely accepted in mainstream climate science.
One might attempt to defend Christy+McNider's estimate by citing other low estimates of climate sensitivity, such as Loehle 2014 from figure 5 above. Of course, that amounts to unjustified cherry-picking that excludes high sensitivity estimates [2; 3; 7; 103; 146; 165 - 179; 304; 317; 318; 346]. Competent scientists need not engage in unjustified cherry-picking of lower or higher estimates. Instead scientists reveal serious flaws in low sensitivity studies [3, page 3; 107, page 1375; 134; 166; 167; 169 - 173; 180; 317; 336; 372]. Correcting these flaws tends to increase the corresponding climate sensitivity estimates [3, page 3; 107; 134; 166; 167; 169 - 173; 180; 336; 372], which provides a clear justification for rejecting these low sensitivity studies. So these low sensitivity estimates fail to lend much credibility to Christy+McNider's low estimate of climate sensitivity.
Christy+McNider reply to high estimates by pointing out uncertainties and problems with the surface temperature record. They suggest these problems may bias climate sensitivity estimates that are based on surface temperature records [1, pages 511 and 514]. However, scientists already addressed the issues mentioned by Christy+McNider; for instance, scientist accounted for the effect of land use changes or urbanization [for example: 181 - 187], as I discuss in "Myth: No Hot Spot Implies Less Global Warming and Support for Lukewarmerism" and in section 3.5 of "Christopher Monckton and Projecting Future Global Warming, Part 1".
Furthermore, Christy+McNider do not address much of the research quantifying the uncertainty in the surface temperature record [for example: 188 - 191]. Nor do they show that the uncertainties for the surface temperature record are greater than the uncertainties for the tropospheric temperature records used by Christy+McNider [1, table 1 on page 512]. The satellite-based tropospheric temperature record [50] comes with greater uncertainty than the surface temperature record, as noted by RSS' Carl Mears [71, from 1:37 to 2:32; 325; 521] (based on his published uncertainty estimates [337; 338] and conference abstract [358]) and contrary to the insinuations made by the myth advocate Paul Homewood [8]; I discussed some of the sources of this tropospheric warming uncertainty in section 3.1. The U.S. Global Change Research Program makes much the same point [326, Appendix A on pages 432 - 433], as does the climate scientist Andrew Dessler [503]: satellite-based trends are likely less reliable and less certain than surface-based trends. This uncertainty further decreases the credibility of Christy+McNider's climate sensitivity estimate relative to sensitivity estimates from surface temperature records.
3.5 Employing self-undermining logic and conflicting with Christy's politically-motivated claims
Christy+McNider cast doubt on the sea surface warming record as part of their justification for not relying on climate sensitivity estimates that are based on surface warming [1, page 514]. This reasoning undermines Christy+McNider's position since Christy+McNider rely on the sea surface temperature record to correct for the effect of ocean cycles [1, page 512]. To make matters worse, Christy+McNider not only undermine their own paper's reasoning, but also undermine Christy's previous co-authored work.
Christy+McNider's paper contradicts two non-peer-reviewed essays co-authored by Christy and posted on a blog [194; 195]. Christy cited these blog articles to Congress [93; 196, page 10], in order to undermine the United States Environmental Protection Agency's (EPA's) regulation of CO2 emissions [194; 195]. In his Congressional testimony, Christy said the following regarding these blog articles:
"Indeed, I am a co-author of a report in which we used a statistical model to reproduce, to a large degree, the atmospheric temperature trends without the need for extra greenhouse gases. In other words, it seems that Mother Nature can cause such temperature trends on her own, which should be of no surprise [93]."
Christy co-authored these blog documents with David D'Aleo [194; 195], a man who (along with Christy's UAH colleague Roy Spencer) uses his religious and political ideology to discount the negative effects of CO2-induced, man-made climate change [16; 17, signers #7 and #35]. D'Aleo also co-founded ICECAP [219], an organization that disparaged the EPA's CO2 regulations by citing Christy's aforementioned blog documents [197].
(I discuss Christy's blog essays extensively in "Myth: The Sun Caused Recent Global Warming and the Tropical Stratosphere Warmed", "John Christy and the Tropical Tropospheric Hot Spot, Part 1", and "John Christy and the Tropical Tropospheric Hot Spot, Part 2".)
In these blog documents, Christy links changes in solar activity to changes in an ocean cycle known as the El Niño-Southern Oscillation (ENSO). Christy then claims that these ocean cycle changes account for much of the post-1979 lower tropospheric warming, to the point that there is no evidence that CO2 has an observable, significant impact on recent temperature trends [194, pages 4, 16, 18, 67 and 68; 195, page 4]. Christy's lies in tension with the myth proponent Paul Homewood's claim that Christy does not deny the effect of greenhouse gases such as CO2 [8]. To support his conclusions on the effects of CO2 and ENSO, Christy uses an ENSO index (the MEI, a.k.a. the multivariate ENSO index) to account for warming from ENSO [194, page 18].
But this is where the problems begin: Christy uses a cumulative MEI in his blog articles [194, page 18]. As pointed out by the climate scientist Timothy Osborn, this cumulative MEI violates basic physics by assuming that warming from ENSO simply accumulates [93], instead of more of this energy being radiated into space as Earth becomes warmer [120; 221; 222]. Scientists can observe an increase in released radiation during the warm El Niño phase of ENSO [223 - 225], as per the Planck feedback and Stefan-Boltzmann law I discussed in section 3.3. So increased radiation during warm El Niño events debunks the implausible physics implied by Christy et al.'s cumulative indices.
Given this violation of basic physical principles, I know of no peer-reviewed scientific paper that uses a cumulative MEI. Scientists (including Christy's UAH colleague Roy Spencer [233, page 231]) instead use a non-cumulative MEI [44; 103; 229 - 237; 243] that does not violate physics. Some researchers accumulate ENSO measures intra-annually, across months within a year [381, page 3655]. This however, yields very different results [381, figures 3 and 4 on pages 3656] from Christy's inter-annual accumulation across multiple years in figure 6 below. It is one thing to say that released energy from ENSO temporarily accumulates for months; it is quite another thing to say that energy accumulates and remains for years or decades.
Christy+McNider follow the practice of using [1, page 512; 363] a published, non-cumulative MEI [232]. They use this non-cumulative MEI, in conjunction two other ocean cycle indices [1, page 512], to show that ocean cycles do not account for the vast majority of the post-1979 lower tropospheric warming [1, pages 513 and 517]. Christy+McNider also imply that CO2 caused statistically significant, observable warming of the troposphere, since their tropospheric TCR estimate of 1.10K +/- 0.26K is greater than 0K and does not overlap with 0K [1].
So Christy+McNider's 2017 peer-reviewed paper conflicts with the following points from Christy's prior 2016 and 2017 non-peer-reviewed blog articles:
- There is no evidence that CO2 caused significant, observable tropospheric warming [194, pages 4, 16, 18, 67 and 68; 195, page 4].
- Solar-linked ENSO events caused most of the post-1979 tropospheric warming [194, pages 16, 18, 67 and 68].
- The cumulative MEI should be used for accounting for ENSO effects of tropospheric warming [194, page 18].
One might wonder whether Christy will correct his blog articles in light of these conflicts. Or maybe he could admit that he cited false, blog-article-based claims in his Congressional testimony [93; 196, page 10]? I doubt that he will make such an admission, since doing so would get in the way of Christy [93; 194; 195; 196, page 10], D'Aleo [194; 195], and ICECAP [197] using these blog articles to mislead those who do not read peer-reviewed climate research (in "John Christy and Atmospheric Temperature Trends", I summarize other examples of Christy misrepresenting climate science in a politically expedient manner).
Fortunately, Asia-Pacific Journal of Atmospheric Science (APJAS), the peer-reviewed journal that published Christy+McNider's paper, did not publish the analysis from Christy's blog articles. This omission is rather telling, since APJAS is not biased against Christy's work nor biased against other research that runs contrary to mainstream climate science. For instance, APJAS previously published research from contrarians such as Christy [69], Richard Lindzen [157], and Christy's UAH colleague Roy Spencer [69; 233; 507].
Of particular note, APJAS published the 2011 paper Choi and Lindzen paper [157] which Christy+McNider cited [1, page 516] and which I discussed in section 3.3. Lindzen intended [157; 238] this 2011 paper [157] to follow up on, and correct, a 2009 Lindzen paper [239]. This 2009 paper argued for low climate sensitivity [239] while committing, in Lindzen's own words, "stupid mistakes [238]," consistent with Lindzen's long history of offering debunked defenses of low climate sensitivity estimates [30, from 34:40 to 36:32, and 37:10 to 39:12; 33, section 4; 53, pages 7 and 8; 107, page 1375; 148, section 1; 158; 320 - 322; 344]. Interestingly, a more reputable journal rejected Choi+Lindzen's 2011 work [158]. And though APJAS eventually published Choi+Lindzen's 2011 work, subsequent research rebutted Choi and Lindzen's 2011 APJAS paper [107, page 1375; 344].
Thus, contrary to the claims of the myth proponent Paul Homewood, scientists can justifiably call APJAS a lower tier journal that published rejected and debunked work from people with a history of making self-admittedly "stupid mistakes [238]." Yet even APJAS did not publish Christy's blog article claims. Instead APJAS published Christy+McNider's research [1], research that contradicted Christy's blog article claims.
So maybe Christy knows he could not get his blog articles' ideas past expert reviewers, even APJAS reviewers more predisposed than most towards letting Christy's contrarian claims slide? Maybe Christy accepts that reviewers would spot the obvious errors in his blog articles' claims? This would explain why the climate scientist Timothy Osborn spotted Christy's errors [93], and why I can find no peer-reviewed papers that use the cumulative MEI from Christy's blog articles. Instead other papers use the non-cumulative MEI to show that ENSO did not cause most of the recent global warming [44; 103; 229; 230; 234 - 237; 243], contrary to Christy blog article claims [194, pages 16, 18, 67 and 68] and consistent with Christy+McNider's paper [1, pages 513 and 517].
Therefore, the story Christy tells non-experts contradicts the story he tells informed experts and reviewers; Christy admits to evidence of man-made, CO2-induced warming when communicating with informed scientists [1, pages 513 and 517], but he then attributes this warming to natural factors when speaking with non-experts who are less likely to spot the errors in what Christy says [93; 194, pages 16, 18, 67 and 68].
Christy+McNider cast doubt on the sea surface warming record as part of their justification for not relying on climate sensitivity estimates that are based on surface warming [1, page 514]. This reasoning undermines Christy+McNider's position since Christy+McNider rely on the sea surface temperature record to correct for the effect of ocean cycles [1, page 512]. To make matters worse, Christy+McNider not only undermine their own paper's reasoning, but also undermine Christy's previous co-authored work.
Christy+McNider's paper contradicts two non-peer-reviewed essays co-authored by Christy and posted on a blog [194; 195]. Christy cited these blog articles to Congress [93; 196, page 10], in order to undermine the United States Environmental Protection Agency's (EPA's) regulation of CO2 emissions [194; 195]. In his Congressional testimony, Christy said the following regarding these blog articles:
Christy co-authored these blog documents with David D'Aleo [194; 195], a man who (along with Christy's UAH colleague Roy Spencer) uses his religious and political ideology to discount the negative effects of CO2-induced, man-made climate change [16; 17, signers #7 and #35]. D'Aleo also co-founded ICECAP [219], an organization that disparaged the EPA's CO2 regulations by citing Christy's aforementioned blog documents [197].
(I discuss Christy's blog essays extensively in "Myth: The Sun Caused Recent Global Warming and the Tropical Stratosphere Warmed", "John Christy and the Tropical Tropospheric Hot Spot, Part 1", and "John Christy and the Tropical Tropospheric Hot Spot, Part 2".)
In these blog documents, Christy links changes in solar activity to changes in an ocean cycle known as the El Niño-Southern Oscillation (ENSO). Christy then claims that these ocean cycle changes account for much of the post-1979 lower tropospheric warming, to the point that there is no evidence that CO2 has an observable, significant impact on recent temperature trends [194, pages 4, 16, 18, 67 and 68; 195, page 4]. Christy's lies in tension with the myth proponent Paul Homewood's claim that Christy does not deny the effect of greenhouse gases such as CO2 [8]. To support his conclusions on the effects of CO2 and ENSO, Christy uses an ENSO index (the MEI, a.k.a. the multivariate ENSO index) to account for warming from ENSO [194, page 18].
But this is where the problems begin: Christy uses a cumulative MEI in his blog articles [194, page 18]. As pointed out by the climate scientist Timothy Osborn, this cumulative MEI violates basic physics by assuming that warming from ENSO simply accumulates [93], instead of more of this energy being radiated into space as Earth becomes warmer [120; 221; 222]. Scientists can observe an increase in released radiation during the warm El Niño phase of ENSO [223 - 225], as per the Planck feedback and Stefan-Boltzmann law I discussed in section 3.3. So increased radiation during warm El Niño events debunks the implausible physics implied by Christy et al.'s cumulative indices.
Given this violation of basic physical principles, I know of no peer-reviewed scientific paper that uses a cumulative MEI. Scientists (including Christy's UAH colleague Roy Spencer [233, page 231]) instead use a non-cumulative MEI [44; 103; 229 - 237; 243] that does not violate physics. Some researchers accumulate ENSO measures intra-annually, across months within a year [381, page 3655]. This however, yields very different results [381, figures 3 and 4 on pages 3656] from Christy's inter-annual accumulation across multiple years in figure 6 below. It is one thing to say that released energy from ENSO temporarily accumulates for months; it is quite another thing to say that energy accumulates and remains for years or decades.
Christy+McNider follow the practice of using [1, page 512; 363] a published, non-cumulative MEI [232]. They use this non-cumulative MEI, in conjunction two other ocean cycle indices [1, page 512], to show that ocean cycles do not account for the vast majority of the post-1979 lower tropospheric warming [1, pages 513 and 517]. Christy+McNider also imply that CO2 caused statistically significant, observable warming of the troposphere, since their tropospheric TCR estimate of 1.10K +/- 0.26K is greater than 0K and does not overlap with 0K [1].
So Christy+McNider's 2017 peer-reviewed paper conflicts with the following points from Christy's prior 2016 and 2017 non-peer-reviewed blog articles:
- There is no evidence that CO2 caused significant, observable tropospheric warming [194, pages 4, 16, 18, 67 and 68; 195, page 4].
- Solar-linked ENSO events caused most of the post-1979 tropospheric warming [194, pages 16, 18, 67 and 68].
- The cumulative MEI should be used for accounting for ENSO effects of tropospheric warming [194, page 18].
One might wonder whether Christy will correct his blog articles in light of these conflicts. Or maybe he could admit that he cited false, blog-article-based claims in his Congressional testimony [93; 196, page 10]? I doubt that he will make such an admission, since doing so would get in the way of Christy [93; 194; 195; 196, page 10], D'Aleo [194; 195], and ICECAP [197] using these blog articles to mislead those who do not read peer-reviewed climate research (in "John Christy and Atmospheric Temperature Trends", I summarize other examples of Christy misrepresenting climate science in a politically expedient manner).
Fortunately, Asia-Pacific Journal of Atmospheric Science (APJAS), the peer-reviewed journal that published Christy+McNider's paper, did not publish the analysis from Christy's blog articles. This omission is rather telling, since APJAS is not biased against Christy's work nor biased against other research that runs contrary to mainstream climate science. For instance, APJAS previously published research from contrarians such as Christy [69], Richard Lindzen [157], and Christy's UAH colleague Roy Spencer [69; 233; 507].
Of particular note, APJAS published the 2011 paper Choi and Lindzen paper [157] which Christy+McNider cited [1, page 516] and which I discussed in section 3.3. Lindzen intended [157; 238] this 2011 paper [157] to follow up on, and correct, a 2009 Lindzen paper [239]. This 2009 paper argued for low climate sensitivity [239] while committing, in Lindzen's own words, "stupid mistakes [238]," consistent with Lindzen's long history of offering debunked defenses of low climate sensitivity estimates [30, from 34:40 to 36:32, and 37:10 to 39:12; 33, section 4; 53, pages 7 and 8; 107, page 1375; 148, section 1; 158; 320 - 322; 344]. Interestingly, a more reputable journal rejected Choi+Lindzen's 2011 work [158]. And though APJAS eventually published Choi+Lindzen's 2011 work, subsequent research rebutted Choi and Lindzen's 2011 APJAS paper [107, page 1375; 344].
Of particular note, APJAS published the 2011 paper Choi and Lindzen paper [157] which Christy+McNider cited [1, page 516] and which I discussed in section 3.3. Lindzen intended [157; 238] this 2011 paper [157] to follow up on, and correct, a 2009 Lindzen paper [239]. This 2009 paper argued for low climate sensitivity [239] while committing, in Lindzen's own words, "stupid mistakes [238]," consistent with Lindzen's long history of offering debunked defenses of low climate sensitivity estimates [30, from 34:40 to 36:32, and 37:10 to 39:12; 33, section 4; 53, pages 7 and 8; 107, page 1375; 148, section 1; 158; 320 - 322; 344]. Interestingly, a more reputable journal rejected Choi+Lindzen's 2011 work [158]. And though APJAS eventually published Choi+Lindzen's 2011 work, subsequent research rebutted Choi and Lindzen's 2011 APJAS paper [107, page 1375; 344].
Thus, contrary to the claims of the myth proponent Paul Homewood, scientists can justifiably call APJAS a lower tier journal that published rejected and debunked work from people with a history of making self-admittedly "stupid mistakes [238]." Yet even APJAS did not publish Christy's blog article claims. Instead APJAS published Christy+McNider's research [1], research that contradicted Christy's blog article claims.
So maybe Christy knows he could not get his blog articles' ideas past expert reviewers, even APJAS reviewers more predisposed than most towards letting Christy's contrarian claims slide? Maybe Christy accepts that reviewers would spot the obvious errors in his blog articles' claims? This would explain why the climate scientist Timothy Osborn spotted Christy's errors [93], and why I can find no peer-reviewed papers that use the cumulative MEI from Christy's blog articles. Instead other papers use the non-cumulative MEI to show that ENSO did not cause most of the recent global warming [44; 103; 229; 230; 234 - 237; 243], contrary to Christy blog article claims [194, pages 16, 18, 67 and 68] and consistent with Christy+McNider's paper [1, pages 513 and 517].
3.6 Contradicting Christy's work and not accounting for the impact of the Sun
Christy+McNider even admit that cumulative TSI indices are arbitrary and compromise the relationship between TSI and the tropospheric temperature trends TSI is used to predict:
"The amplitude of the 11-year [solar] cycle has diminished since the peak in 2000 and, in our residual time series, there is indeed a slight slowdown in the rise after 1998. One may arbitrarily [emphasis added] select an accumulation period of TSI, so that a peak occurs near 1998 so the TSI coincides with (explains) variations in [lower tropospheric temperature] (e.g., a 22-year TSI trailing average peaks in 2000, though other averaging periods do not), but this would compromise the independence between the predictors and predictand [emphasis added] [the predictor is the factor used to predict the predictand] [1, page 514]."
Christy+McNider also state that changes in TSI do not account for the most of the lower tropospheric warming trend from 1979 to the present [1, page 514]. Yet Christy's blog articles argues that solar-induced changes in ENSO caused most of the recent lower tropospheric warming [194, pages 16, 18, 67 and 68]. And Christy's blog articles support this claim by using the sort of cumulative TSI [194, page 18] that Christy+McNider says "arbitrarily selec[ts] an accumulation period [1, page 514]" and "compromis[es] the independence between the predictors [TSI] and the predictand [lower tropospheric warming] [1 page 514]."
So the story Christy tells non-experts once again contradicts the story he tells informed experts and reviewers; Christy admits that changes in solar activity likely do not explain lower tropospheric warming from 1979 to the present when communicating with informed scientists [1, page 514], but he then attributes this warming to changes in solar activity when speaking with non-experts who are less likely to recognize the distortions in what Christy says [194, pages 16, 18, 67 and 68].
I know of no peer-reviewed papers that use Christy's cumulative TSI index, just as I know of no peer-reviewed papers that use Christy's cumulative MEI. This is likely because other scientists and reviewers recognize that the flaw in these arbitrary indices, just as Christy+McNider [1, page 514] and Osborn did [93]. Scientists (including Christy himself [241] and the sources [240; 241] he relies on [194, page 18; 195, page 18]) instead use a non-cumulative TSI [44; 103; 229; 230; 240; 241; 243] that does not violate basic physics, is not abritrary, and does not compromise the independence of TSI and temperature trends. Figures 6 and 7 compare a non-cumulative TSI estimate to Christy's cumulative TSI:
 |
Figure 6: Cumulative TSI and cumulative ENSO index used by Christy in his blog articles [194, page 18].
|
 |
Figure 7: Non-cumulative TSI from the NOAA's Climate Data Record (CDR), based on satellite observations. The peaks and troughs represent the 11 year solar cycle. Data sources are SORCE TIM (Solar Radiation and Climate Experiment, with Total Irradiance Monitor), ACRIM (Active Cavity Radiometer Irradiance Monitor) and PMOD (Physikalisch-Meteorologisches Observatorium Davos) [242].
|
Figure 7 shows an 11-year cycle in solar output. Once one corrects for this cycle, there is not a post-1979 increase in TSI [242]. Yet Christy blog article transforms this lack of an increase into a cumulative TSI increase [194, page 18], as shown in figure 6. Christy performs this transformation using the faulty method Christy+McNider critiqued above: arbitrarily selecting an accumulation period, thus compromising the relationship between TSI (the predictor) and temperature trends (the predictands) [1, page 514].
Given the post-1979 decrease in TSI [242], increased solar irradiance does not account for most post-1970s global warming [44; 103; 229; 230; 243], including most post-1970s tropospheric warming [229; 230; 243]. So TSI does not correlate well with most of the recent global warming [244 - 247] (in "Myth: The Sun Caused Recent Global Warming and the Tropical Stratosphere Warmed" I explain other lines of evidence showing that changes in solar activity did not cause most of the recent global warming).
This TSI decrease not only rebuts Christy's blog articles, but also creates a problem for Christy+McNider's position. To see why, note that Christy+McNider estimate the warming effect of greenhouse gases (GHGs) as follows:
Equation 1 : GHG = TW - SST - V - H - X
where:
- "GHG" is lower tropospheric warming caused by increases in well-mixed greenhouse gases such as CO2
- "TW" represents the observed lower tropospheric warming trend
- "SST" is the sea surface temperature correction for ocean cycles such as ENSO
- "V" is a correction for the effect of volcanic aerosols
- "H" includes other human influences on climate, such as man-made aerosols
- "X" represents other factors, such as internal climate fluctuations [1, page 514]
X should include the effect of changes in TSI. The decreasing TSI from figure 7 would make X more negative, given the cooling effect of decreasing TSI. But crucially, Christy+McNider assume the X is 0 [1, pages 514 and 516]; they make no attempt to defend this assumption [1, page 514]. If, however, X was negative due to the impact of decreasing TSI, then Christy+McNider under-estimate GHG when they assume X is 0; they would thereby under-estimate climate sensitivity. Thus Christy+McNider likely under-estimate climate sensitivity by not including the cooling effect of decreased solar output.
(Similar problems arise for other factors in equation 1. For example, in section 3.1 I argued that Christy+McNider underestimate TW and thus under-estimate GHG, along with under-estimating climate sensitivity. Furthermore, if greenhouse gases augment warming from ocean cycles, then warming from GHG would be incorrectly attributed to just SST. This would cause equation 1 to under-estimate GHG, and thus under-estimate climate sensitivity. Though some research suggests that greenhouse gases may influence the frequency and/or intensity of ocean cycles [249 - 251; 328; 329; 330, page 99], Christy+McNider assume that human activity has no effect on these ocean cycles [1, page 514].
Moreover, if scientists under-estimated [248] the cooling effect of man-made aerosols [30, from 40:29 to 45:59; 148, section 1; 167; 169; 248; 252, pages 1328 and 1329; 253; 254, page 5827; 303; 319; 354; 359; 390; 391, pages 695 - 701; 523], then H would be too positive. This would cause equation 1 to under-estimate GHG and therefore under-estimate climate sensitivity. Some research suggests that observed aerosol trends support higher climate sensitivity estimates [30, from 40:29 to 45:59; 167; 169]. Christy+McNider instead suggest that scientists may over-estimate aerosol-induced cooling [1, page 515].)
3.7 Related myths on the rate and causes of recent tropospheric warming
According to one myth proponent, Christy+McNider show that the atmosphere has not warmed for the past two decades [18]. This is false since Christy+McNider clearly depict tropospheric warming over the past two decades [1, table 2 and figure 1 on page 513]. This represents a change of position for Christy, since he once falsely claimed that the troposphere had not warmed for two decades [26; 255], as I discuss in "Myth: No Global Warming for Two Decades".
Instead of denying recent tropospheric warming, a number of myth proponents claim that Christy+McNider show that global warming has not accelerated, once Christy+McNider's correct for volcanic and SST effects [8 - 15; 18 - 20; 220]. This lack of acceleration is not a problem for mainstream climate science for at least two reasons.
First, a more-linear CO2-induced warming trend does not imply that this warming has linear effects. Take, for example, the relationship between warming and sea level rise. Slight global cooling occurred from the 1940s to 1970s (I discuss this cooling further below, alongside figure 8), followed by near-linear surface warming occurred from the 1970s to the present [44; 89; 256; 257]. Concurrent with this warming, sea level rise accelerated post-1970s [258 - 263; 264, table 2; 265, figure 3; 266, figure 1B; 341] to the higher rates seen post-1990 [258; 265 - 271; 341; 342]. This in agreement with future projections of the rate [272 - 279; 286] and impact of sea level rise [281 - 283; 286], along with other research on how warming [279; 280; 342], CO2 [284; 286], and man-made greenhouse gases impact globally-averaged sea level rise [285 - 295] (though there is some conflicting evidence [294; 296] on the shorter-term impact of man-made CO2 on sea level rise in particular regions). So a more-linear CO2-induced warming can lead to accelerated, non-linear effects, as in the case of accelerated sea level rise.
Second, mainstream climate science predicts that the CO2-induced warming trend should be almost linear [37; 42 - 48]. To see why, first note that the relationship between CO2 and warming is logarithmic, not linear. This means that within a certain range of CO2 levels, doubling CO2 levels results in the same amount of warming, regardless of whether that doubling is 200 parts per million (ppm) up to 400ppm, or 400ppm up to 800ppm [23, pages 736 and 740; 37]; this relationship, however, breaks down in extreme cases [49]. Furthermore, atmospheric CO2 levels increased in a roughly exponential manner over the past two centuries [38; 40; 41, page 3; 356; 366, figure 6], alongside a near-exponential increase in CO2 emissions from burning of fossil fuels [39; 366, figure 6].
This near-exponential increase in atmospheric CO2 caused a more-linear CO2-induced warming trend [37; 42 - 48], given the logarithmic relationship between increased CO2 levels and increased temperature [23, pages 736 and 740; 37; 355, chapter 4]. Thus CO2-induced warming from human combustion of fossil fuels dates back to at least the mid-to-late 1800s, if not earlier [37; 44; 178, page 2349; 257; 349; 350, page 1]. Short-term variability (from factors such as ocean cycles) and chance / statistical noise temporarily augment or mitigate this underlying, more-linear CO2-induced warming trend [30, from 40:29 to 45:59; 37; 42; 44; 45]. Figure 8 below illustrates this point, by showing how ocean cycles, changes in solar output, and volcanic effects operate in conjunction with more-linear CO2-induced warming I discuss this in more detail in section 2.10 of "Myth: Attributing Warming to CO2 Involves the Fallaciously Inferring Causation from a Mere Correlation"):
 |
Figure 8: (a) Global surface temperature trend from 1856 - 2010 after correcting for TSI (total solar irradiance, a measure of the solar radiation reaching Earth), El Niño-Southern Oscillation (ENSO), and volcanic aerosols. The upper-left, boxed inset depicts a measurement of the Atlantic Multi-decadal Oscillation (AMO), a cycle that affects ocean temperatures. (b) Global surface temperature trend after correcting for the AMO, TSI, ENSO, and volcanic aerosols [44]. It's unclear whether the AMO is an independent cause of ocean warming vs. the AMO being a type of ocean warming caused by other factors [253; 298 - 300; 340, page 171; 510 - 518]. There is also some dispute over whether the AMO impacts temperature as strongly as is shown panel (b) [301; 345]. For instance, aerosols, instead of just the AMO, partially offset CO2-induced warming during the 1940s to 1970s [30, from 40:29 to 45:59; 148, section 1; 167; 169; 248; 252, pages 1328 and 1329; 254, page 5827; 319; 354; 359; 378, as per 379, section 26.2; 390; 391, pages 695 - 701; 428; 500; 501; 510; 511; 518]. Some sources attribute much of the recent warming to the AMO [44; 305; 306], while other sources argue that the AMO does not account for much of the recent warming [298; 304; 307 - 310; 345; 368; 369; 377; 510]. In either case, greenhouse gases such as CO2 substantially contributed to recent global warming [253; 298; 299; 301; 304; 310 - 314; 368; 369; 377; 510; 519]. And since the post-1964 multi-decadal global warming trend extends over more than 50 years [81; 382, figure 1b; 383, page S17; 384; 385; 386 and 389, generated using 387, as per 388], the 30-year increasing portion of the 60-year AMO cycle likely does not account for such a long warming trend. For example, François Gervais proposes that the AMO undermines claims of a large, man-made CO2-induced warming trend [306]. Gervais' position implies a number of false claims tied to the downward phase of the AMO, including that [306, pages 129, 132, figure 4, and figure 5] satellite-based analyses show post-2002 cooling [26; 50; 67; 383, page S17; 407; 431], that [306, pages 129, 130, 132, and figure 2b] the Earth's surface cooled post-1998 [89; 102; 349; 369, figure 1A; 383, page S12; 432 - 442], that [306, page 132 and figure 2a] the rate of sea level rise decreased post-1998 [268; 443; 444, figure 2 on page 1555; 445, figure 3 on page 8], and that [306, pages 131, 132, and figure 3] the rate of global sea ice melt was greatly mitigated [431; 446; 447]. I address these false claims more in "Myth: No Global Warming for Two Decades". Judith Curry and Anastasios Tsonis both [308; 448; 449; 488] also propose a large role for the AMO. This caused Curry [450 - 454; 508; 509] and Tsonis [455, page 4; 456; 457; 458; 459, paragraphs 14 and 15], like Gervais [306, pages 129, 130, 132, figure 2b, figure 4, and figure 5], to falsely predict a lack of warming when warming actually occurred. Moreover, other contrarians made false claims regarding warming due to an over-reliance on a ~60-year cycle; these contrarians include DocMartyn writing for Judith Curry's blog [460], Javier on Curry's blog [484 - 487; 499], Nicola Scafetta [461, figure 5; 462, figure 12; 463, figure 16; 464, figure 6; 465, page 74 and figure 5 on page 82], Craig Loehle [465, page 74 and figure 5 on page 82; 466, figure 6], Rolf Werner (in otherwise commendable work co-authored with Dimitar Valev, Dimitar Danov, Veneta Guineva, and Andrey Kirillov) [522], Syun-Ichi Akasofu [467, figure 5], Don Easterbrook [468 - 470; 471, pages 1 and 2; 480, figure 24 on page 456], Joseph D'Aleo [480, figure 24 on page 456; 481 - 483], Nils-Axel Mörner [489, section 2.2], Clive Best [479], Pat Frank [504; 505], Girma Orssengo [472, figure 3], William Gray [490, figure 14 on page 13; 491; 492], Dietrich Koelle [473], Fritz Vahrenholt [474], Sebastian Lüning [474; 475], Leonid B. Klyashtorin [476, figure 5; 506], Alexey A. Lyubushin [476, figure 5; 506], Joachim Seifert [477, pages 2, figure 2, and figure A4], Frank Lemke [477, pages 2, figure 2, and figure A4], Thayer Watkins [493 - 495], and David J. Pristash [478]. Thus over-estimation of the AMO's relative impact led a number of contrarians to falsely predict that global warming would cease with the downward phase of the AMO. Norman C. Trelour [496 - 498] attempts to explain recent warming, while maintaining the 60-year cycle; this leads Trelour to accept a near-exponential greenhouse-gas-induced warming trend that dwarfs the temperature trend from the 60-year cycle [497; 498]. |
Figure 8 [44] illustrates how short-term variations from changes in solar output [44; 302], ENSO, etc., can operate in conjunction with long-term, CO2-induced warming [30, from 40:29 to 45:59; 37; 42; 44; 45; 357]. This is analogous to how weekly weather patterns can operate in conjunction with a seasonal, multi-month, axial-tilt-induced warming trend in Canada from mid-winter to mid-summer [201, from 5:22 - 11:22]. So using short-term temperature variations to object to CO2-induced warming, would be as fallacious as using weekly weather patterns to object to axial-tilt-induced seasonal warming. This fallacy in reasoning is known as endpoint bias, in which one infers that a recent short-term fluctuation rebuts a long-term trend [297]. Scientists and non-scientists repeatedly warn against evading long-term trends by cherry-picking shorter-term fluctuations [58, page 16; 297], especially fluctuations beginning with strong ENSO years such as 1998 [26; 51; 92; 94; 101, page 194; 102; 103; 105; 106].
Investor's Business Daily and Rick Moran engage in endpoint bias when they assert that Christy+McNider "destro[y] the models that predict rising temps that correlate with rising CO2 levels [13; 220]." Moran bases his claim on shorter-term tropospheric warming trends [13; 220], while running afoul of evidence showing the longer-term correlation between CO2 and temperature [2; 5 - 7; 38; 202 - 218; 346]. Moran and Investor's Business Daily also misrepresent Christy+McNider's work [13; 220], since Christy+McNider's tropospheric TCR estimate implies that CO2 caused most of the tropospheric warming [1] and thus that CO2 correlates with underlying temperature changes. So Christy+McNider's paper implies, as opposed to contradicts, the idea that CO2 correlates with changes in temperature.
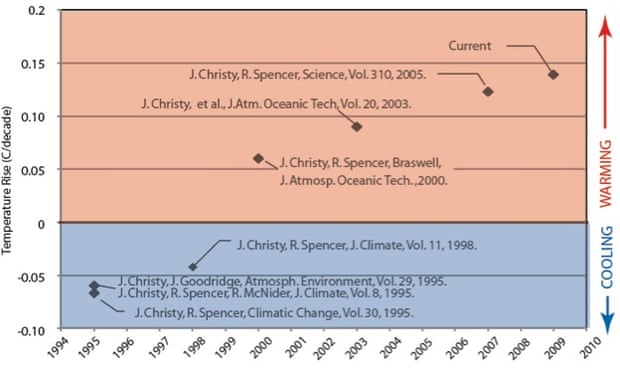
No comments:
Post a Comment