- The Myth and Its Flaws
- Context and Analysis (divided into multiple sections)
- Posts Providing Further Information and Analysis
- References
This is the "+References" version of this post, which means that this post contains my full list of references and citations. If you would like an abbreviated and easier to read version, then please go to the "main version" of this post.
References are cited as follows: "[#]", with "#" corresponding to the reference number given in the References section at the end of this post.
1. The Myth and Its Flaws
In 1997 [677] or 1998, global warming paused / underwent a hiatus [4; 5; 7; 8 - 10; 13; 54; 55; 57; 670; 680], and will likely continue to do so until the 2030s [4; 9; 14; 57; 1182, with 1180]. Moreover, climate shifted in 2001/2002 [2; 3], supporting a prediction of post-2002 global cooling [3]. This rebuts the United Nations Intergovernmental Panel on Climate Change's (IPCC's) [7; 10; 54; 55; 98] use of climate models [1140] to predict global warming, since the IPCC predicted a warming trend of about ~0.2°C/decade [7; 18; 97; 98; 211; 212, as per 211, 213, and 214; 215; 216, page 133; 217, figure 3; 218, pages 14 - 15; 219; 220, section 3.4; 221 - 223; 224, page 84; 225, page 16; 226; 227, figure 24 on page 456; 228]. Consistent with this lack of warming, as of the beginning of 2019, 2018 would not be one of the top five warmest years in the thermometer record [32].
Judith Curry is the primary promoter of the aforementioned myths [2 - 5; 7 - 10; 13; 14; 32; 54; 55; 57]; she peddled similar claims to United States Congress [19; 313; 314, pages 3 - 4]. Other sources endorse, or provide a venue for, her myth. This includes Climate Depot [27 - 29; 248], WattsUpWithThat [30; 31], The Global Warming Policy Foundation (GWPF) [58], Robert Bradley Jr. of the Master Resource blog [53], Patrick Michaels [34, page 56; 945], Roger Pielke Jr. [1183, 1184], Chip Knappenberger [24, page 56], David Rose in The Daily Mail [55; 250; 680; 943; 944] (and in The Spectator [868]), and The Wall Street Journal [6; 7]. Others offer portions of the myth independently of Curry, such as Steven F. Hayward in Washington Examiner [212 - 214], Sherelle Jacobs and Hayley Dixon in The Daily Telegraph [874; 1112], Graham Lloyd in The Australian [956; 957], Björn Lomborg in The Guardian [958], David Whitehouse of GWPF [867, pages 5, 7, 8, 10, and 61], Joseph D'Aleo [227, figure 24 on page 456] of ICECAP and Weatherbell Analytics, the "lukewarmer" [230] Lucia Liljegren of Rank Exploits [231; 1100; 1101], Girma Orssengo [217, figure 3] in WattsUpWithThat [221], Dietrich E. Koelle in NoTricksZone [222], Matti Vooro in NoTricksZone [226], David Pristash in Principia Scientific International [225, page 16], Anastasios Tsonis [190, page 4; 191, paragraphs 14 and 15; 192 - 194], Nicola Scafetta [216, page 133; 220, section 3.4; 224, page 84], Craig Loehle [224, page 84], Syun-Ichi Akasofu [246, section 3; 807, citing 808 - 810, for 811; similar point in: 812 - 814; 1127], Fritz Vahrenholt [223], Sebastian Lüning [223], Don Easterbrook [227, figure 24 on page 456; 228], Norman J. Page [218, pages 14 - 15; 219], David Friedman [215], the "lukewarmer" [1181] Thomas Fuller [1178, with 1179], and any of the dozens of people listed in section 1 of "Myth: No Global Warming for Two Decades".
The myth's flaws: 2018 was the fourth warmest year in the instrumental record, as of the beginning of 2019 [35, pages S5 and S11; 161; 162, section 7.1; 163; 323]. Furthermore, global warming continued post-1997, post-1998, and post-2002, according to sources [175; 178 - 182] Curry herself endorses [16; 18 - 20; 303; 337; 681; 925; 927] (figure 4 below, its caption, and the paragraph beneath the caption), and at a rate consistent with [1, as per 158, figure S1; 63; 64; 167; 310; 311, figure 7; 312; 883 (with 732)] the IPCC's model-based projections [45, page 1010 and figure 11.25b on page 1011; 159, page 7; 160, page 763; 836, section 3.2 on page 45] (figures 2, 3, and 4 below). The warming was so clear that by late 2019, researchers such as Zeke Hausfather [843, confirmed using 76, along with 849 and 850 (generated using 152, as per 153); 939, confirmed using 76, along with 940 and 941 (generated using 152, as per 153)] and Grant Foster [559 and 671, confirmed using 1071 - 1076, generated using 152, as per 153; 984 (with 1058, 1059, and 1064)] pointed to tentative evidence of global warming accelerating since 1998, consistent with other sources on accelerating climate change [442; 445; 841; 842; 845 - 848; 851; 938; 999 (with: 1000 - 1003; 1130; 1131; 1153, supplemental figure S6e); 1071 - 1076 and 1109 - 1111, generated using 152, as per 153; 1097; 1120 - 1122], as per figure 8 below. Curry's preferred data source [681; 925; 927] even shows accelerating global warming [559 and 671, confirmed using 1071 - 1073 (generated using 152, as per 153); 984 (with 1058, 1059, and 1064)]. Despite this she continues to falsely claim a warming hiatus that continues through at least 2023 [1182; 1186, with 1187 and 1190], to the point of contradicting herself [1180].
The IPCC's 2018 Special Report also noted that human-made global warming continued at a rate of ~0.2°C/decade, in accordance with climate models [378, pages 4 and 57 - 59]. Consistent with this, the Berkeley Earth research group showed warming continued at 0.19°C/decade [675; supported by 76 and 826 (generated using 152, as per 153)]. Long before this announcement, Curry worked with Berkeley Earth on their temperature trend analyses [333; 334; 337], expressed pleasure in how they turned out [337], and reported confidence in Berkeley Earth's results [303; 337]. Yet Berkeley Earth's results now refute her predictions.
Thus Judith Curry's temperature trend forecasts failed. This failure:
- diminishes Curry's credibility as a forecaster, along with diminishing the credibility of the other myth advocates listed above
- undercuts the credibility of Curry's company Climate Forecast Applications Network, or CFAN [2; 233; 299; 300], for whom she makes forecasts [234 - 236; 495 - 497] and publishes reports on topics such as sea level rise [237], hurricanes [315; 418; 419], and wildfires [418; 419]
- undermines Curry's claims on a number of warming-related topics, including her stadium wave hypothesis on ocean cycles strongly affecting long-term temperature trends [5; 9; 57; 250; 417 (with: 183 - 189; 1158; 1159)], her position on climate shifts [2; 3], on the relative importance of ocean cycles vs. greenhouse gases when it comes to global warming (Curry downplayed how much human-made greenhouse-gas-induced warming would occur, in the form of climate sensitivity) [5; 7; 14; 57; 98], on projections of hurricane intensity and frequency [234; 235; 315 - 320], on ice melt [20; 250; 260 - 263], on sea level rise [56; 164 - 166; 232, section 5; 263], and on wildfires [418; 419]
- rebuts one of the central pillars of Curry's critique of the IPCC [7; 8; 10; 18; 54; 55; 98; 672; 1112; 1185]
- undercuts her justification for her policy position [7; 498 (with 383); 508; 556; 557; 707 - 710; 730; 1128, page 123]
- provides another sound reason for non-experts to trust the IPCC and their model-based projections over Curry's proclamations, despite the IPCC's tendency to often under-estimate climate change trends [195, page 86; 196 - 210; 398, page 1-13 in section 1.4] (as the IPCC itself acknowledges [398, page 1-13 in section 1.4], among others [1123, updated in 817 and 1124]) and congruent with the IPCC's tendency to use non-alarmist, conservative language that acknowledges when uncertainty is present [357 - 361; 385]
So while Curry offered failed temperature trend predictions for the post-1997 period, the IPCC accurately forecasted post-1997 temperature trends, along with correctly predicting post-1990 human-made global warming and sea level rise, as discussed in "Myth: The IPCC's 1990 Report Over-estimated Greenhouse-gas-induced Global Warming". During this same 1990 - 2019 period that began with the IPCC's 1990 First Assessment Report [560], ocean de-oxygenation continued, oceans became ~13% more acidic due to human-made greenhouse gas increases, ice melted across the globe, and a human-made mass extinction progressed, as discussed in section 2.1 of "Myth: Ocean Acidification Requires that an Ocean Becomes an Acid".
Scientists, including those at the IPCC [378; 398; 815, pages 6 - 16], continued to discuss the risks of this human-made climate change [253; 378; 398; 742, section 17 on page 19; 757, from 30:01 to 32:32; 773; 774; 815, pages 6 - 16; 816, page 17; 817, figure 2 for v007 and figure 88 for v043; 818 - 824; 889; 937; 1025, from 20:55 to 25:15]. This occurred while Curry quietly dropped and evaded the subject of her failed hiatus predictions [13; 415; 416; 731 (from 233, compare: 607, 664 - 666; to: 176; 313; 314; 663); 861; 863; 951, with 950 and 960], downplayed the impact of human-made greenhouse gas emissions on climate [5; 7; 14; 57; 98; 497; 498 (with 383); 499; 1154 (with: 1155; 1156); 1157; 1160 (with 1161)], and unjustifiably smeared climate scientists who recognized these impacts [10 - 12; 96; 345; 372; 756; 932], to the point of Curry insinuating that the IPCC should be euthanized [10]. When the first two decades of the 21st century [211; 677, with 972] concluded on the time-frame Curry pre-selected [13; 863], Curry simply moved the goalposts to the future instead of admitting evidence showed her predictions were wrong [1175; 1176], and she behaved as if she did not make those false claims [1177]. So Curry made her claims in bad faith. All the while, Curry, who leans toward a libertarian political ideology [486], argued against various climate-related policies [7; 498 (with 383); 508; 556; 557; 707 - 710; 730; 1128, page 123] and continued to receive funding from the fossil fuel / energy industries [372 (cited by 501 and 502); 602; 616; 617]. As Curry says:
"the whole point of my essay is that pause and low sensitivity makes 'urgent action to reduce emissions' much less defensible [730]"
(The following blogpost and Twitter threads cover some of the material discussed in this blogpost:
- "Myth: No Global Warming for Two Decades"
- https://twitter.com/AtomsksSanakan/status/1331409367757975553
- https://twitter.com/AtomsksSanakan/status/1074861836086992896
- https://twitter.com/AtomsksSanakan/status/1070779789966000128
A list of some of Curry's other distortions can be found in:
In 1997 [677] or 1998, global warming paused / underwent a hiatus [4; 5; 7; 8 - 10; 13; 54; 55; 57; 670; 680], and will likely continue to do so until the 2030s [4; 9; 14; 57; 1182, with 1180]. Moreover, climate shifted in 2001/2002 [2; 3], supporting a prediction of post-2002 global cooling [3]. This rebuts the United Nations Intergovernmental Panel on Climate Change's (IPCC's) [7; 10; 54; 55; 98] use of climate models [1140] to predict global warming, since the IPCC predicted a warming trend of about ~0.2°C/decade [7; 18; 97; 98; 211; 212, as per 211, 213, and 214; 215; 216, page 133; 217, figure 3; 218, pages 14 - 15; 219; 220, section 3.4; 221 - 223; 224, page 84; 225, page 16; 226; 227, figure 24 on page 456; 228]. Consistent with this lack of warming, as of the beginning of 2019, 2018 would not be one of the top five warmest years in the thermometer record [32].
Judith Curry is the primary promoter of the aforementioned myths [2 - 5; 7 - 10; 13; 14; 32; 54; 55; 57]; she peddled similar claims to United States Congress [19; 313; 314, pages 3 - 4]. Other sources endorse, or provide a venue for, her myth. This includes Climate Depot [27 - 29; 248], WattsUpWithThat [30; 31], The Global Warming Policy Foundation (GWPF) [58], Robert Bradley Jr. of the Master Resource blog [53], Patrick Michaels [34, page 56; 945], Roger Pielke Jr. [1183, 1184], Chip Knappenberger [24, page 56], David Rose in The Daily Mail [55; 250; 680; 943; 944] (and in The Spectator [868]), and The Wall Street Journal [6; 7]. Others offer portions of the myth independently of Curry, such as Steven F. Hayward in Washington Examiner [212 - 214], Sherelle Jacobs and Hayley Dixon in The Daily Telegraph [874; 1112], Graham Lloyd in The Australian [956; 957], Björn Lomborg in The Guardian [958], David Whitehouse of GWPF [867, pages 5, 7, 8, 10, and 61], Joseph D'Aleo [227, figure 24 on page 456] of ICECAP and Weatherbell Analytics, the "lukewarmer" [230] Lucia Liljegren of Rank Exploits [231; 1100; 1101], Girma Orssengo [217, figure 3] in WattsUpWithThat [221], Dietrich E. Koelle in NoTricksZone [222], Matti Vooro in NoTricksZone [226], David Pristash in Principia Scientific International [225, page 16], Anastasios Tsonis [190, page 4; 191, paragraphs 14 and 15; 192 - 194], Nicola Scafetta [216, page 133; 220, section 3.4; 224, page 84], Craig Loehle [224, page 84], Syun-Ichi Akasofu [246, section 3; 807, citing 808 - 810, for 811; similar point in: 812 - 814; 1127], Fritz Vahrenholt [223], Sebastian Lüning [223], Don Easterbrook [227, figure 24 on page 456; 228], Norman J. Page [218, pages 14 - 15; 219], David Friedman [215], the "lukewarmer" [1181] Thomas Fuller [1178, with 1179], and any of the dozens of people listed in section 1 of "Myth: No Global Warming for Two Decades".
The myth's flaws: 2018 was the fourth warmest year in the instrumental record, as of the beginning of 2019 [35, pages S5 and S11; 161; 162, section 7.1; 163; 323]. Furthermore, global warming continued post-1997, post-1998, and post-2002, according to sources [175; 178 - 182] Curry herself endorses [16; 18 - 20; 303; 337; 681; 925; 927] (figure 4 below, its caption, and the paragraph beneath the caption), and at a rate consistent with [1, as per 158, figure S1; 63; 64; 167; 310; 311, figure 7; 312; 883 (with 732)] the IPCC's model-based projections [45, page 1010 and figure 11.25b on page 1011; 159, page 7; 160, page 763; 836, section 3.2 on page 45] (figures 2, 3, and 4 below). The warming was so clear that by late 2019, researchers such as Zeke Hausfather [843, confirmed using 76, along with 849 and 850 (generated using 152, as per 153); 939, confirmed using 76, along with 940 and 941 (generated using 152, as per 153)] and Grant Foster [559 and 671, confirmed using 1071 - 1076, generated using 152, as per 153; 984 (with 1058, 1059, and 1064)] pointed to tentative evidence of global warming accelerating since 1998, consistent with other sources on accelerating climate change [442; 445; 841; 842; 845 - 848; 851; 938; 999 (with: 1000 - 1003; 1130; 1131; 1153, supplemental figure S6e); 1071 - 1076 and 1109 - 1111, generated using 152, as per 153; 1097; 1120 - 1122], as per figure 8 below. Curry's preferred data source [681; 925; 927] even shows accelerating global warming [559 and 671, confirmed using 1071 - 1073 (generated using 152, as per 153); 984 (with 1058, 1059, and 1064)]. Despite this she continues to falsely claim a warming hiatus that continues through at least 2023 [1182; 1186, with 1187 and 1190], to the point of contradicting herself [1180].
The IPCC's 2018 Special Report also noted that human-made global warming continued at a rate of ~0.2°C/decade, in accordance with climate models [378, pages 4 and 57 - 59]. Consistent with this, the Berkeley Earth research group showed warming continued at 0.19°C/decade [675; supported by 76 and 826 (generated using 152, as per 153)]. Long before this announcement, Curry worked with Berkeley Earth on their temperature trend analyses [333; 334; 337], expressed pleasure in how they turned out [337], and reported confidence in Berkeley Earth's results [303; 337]. Yet Berkeley Earth's results now refute her predictions.
Thus Judith Curry's temperature trend forecasts failed. This failure:
- diminishes Curry's credibility as a forecaster, along with diminishing the credibility of the other myth advocates listed above
- undercuts the credibility of Curry's company Climate Forecast Applications Network, or CFAN [2; 233; 299; 300], for whom she makes forecasts [234 - 236; 495 - 497] and publishes reports on topics such as sea level rise [237], hurricanes [315; 418; 419], and wildfires [418; 419]
- undermines Curry's claims on a number of warming-related topics, including her stadium wave hypothesis on ocean cycles strongly affecting long-term temperature trends [5; 9; 57; 250; 417 (with: 183 - 189; 1158; 1159)], her position on climate shifts [2; 3], on the relative importance of ocean cycles vs. greenhouse gases when it comes to global warming (Curry downplayed how much human-made greenhouse-gas-induced warming would occur, in the form of climate sensitivity) [5; 7; 14; 57; 98], on projections of hurricane intensity and frequency [234; 235; 315 - 320], on ice melt [20; 250; 260 - 263], on sea level rise [56; 164 - 166; 232, section 5; 263], and on wildfires [418; 419]
- rebuts one of the central pillars of Curry's critique of the IPCC [7; 8; 10; 18; 54; 55; 98; 672; 1112; 1185]
- undercuts her justification for her policy position [7; 498 (with 383); 508; 556; 557; 707 - 710; 730; 1128, page 123]
- provides another sound reason for non-experts to trust the IPCC and their model-based projections over Curry's proclamations, despite the IPCC's tendency to often under-estimate climate change trends [195, page 86; 196 - 210; 398, page 1-13 in section 1.4] (as the IPCC itself acknowledges [398, page 1-13 in section 1.4], among others [1123, updated in 817 and 1124]) and congruent with the IPCC's tendency to use non-alarmist, conservative language that acknowledges when uncertainty is present [357 - 361; 385]
So while Curry offered failed temperature trend predictions for the post-1997 period, the IPCC accurately forecasted post-1997 temperature trends, along with correctly predicting post-1990 human-made global warming and sea level rise, as discussed in "Myth: The IPCC's 1990 Report Over-estimated Greenhouse-gas-induced Global Warming". During this same 1990 - 2019 period that began with the IPCC's 1990 First Assessment Report [560], ocean de-oxygenation continued, oceans became ~13% more acidic due to human-made greenhouse gas increases, ice melted across the globe, and a human-made mass extinction progressed, as discussed in section 2.1 of "Myth: Ocean Acidification Requires that an Ocean Becomes an Acid".
Scientists, including those at the IPCC [378; 398; 815, pages 6 - 16], continued to discuss the risks of this human-made climate change [253; 378; 398; 742, section 17 on page 19; 757, from 30:01 to 32:32; 773; 774; 815, pages 6 - 16; 816, page 17; 817, figure 2 for v007 and figure 88 for v043; 818 - 824; 889; 937; 1025, from 20:55 to 25:15]. This occurred while Curry quietly dropped and evaded the subject of her failed hiatus predictions [13; 415; 416; 731 (from 233, compare: 607, 664 - 666; to: 176; 313; 314; 663); 861; 863; 951, with 950 and 960], downplayed the impact of human-made greenhouse gas emissions on climate [5; 7; 14; 57; 98; 497; 498 (with 383); 499; 1154 (with: 1155; 1156); 1157; 1160 (with 1161)], and unjustifiably smeared climate scientists who recognized these impacts [10 - 12; 96; 345; 372; 756; 932], to the point of Curry insinuating that the IPCC should be euthanized [10]. When the first two decades of the 21st century [211; 677, with 972] concluded on the time-frame Curry pre-selected [13; 863], Curry simply moved the goalposts to the future instead of admitting evidence showed her predictions were wrong [1175; 1176], and she behaved as if she did not make those false claims [1177]. So Curry made her claims in bad faith. All the while, Curry, who leans toward a libertarian political ideology [486], argued against various climate-related policies [7; 498 (with 383); 508; 556; 557; 707 - 710; 730; 1128, page 123] and continued to receive funding from the fossil fuel / energy industries [372 (cited by 501 and 502); 602; 616; 617]. As Curry says:
"the whole point of my essay is that pause and low sensitivity makes 'urgent action to reduce emissions' much less defensible [730]"
(The following blogpost and Twitter threads cover some of the material discussed in this blogpost:
- "Myth: No Global Warming for Two Decades"
- https://twitter.com/AtomsksSanakan/status/1331409367757975553
- https://twitter.com/AtomsksSanakan/status/1074861836086992896
- https://twitter.com/AtomsksSanakan/status/1070779789966000128
2. Context and Analysis
Section 2.1: Sources Curry Lauds Debunk Her Temperature Trend Predictions
For the better part of a decade, the climate scientist Judith Curry claimed global warming underwent a pause or a hiatus [4; 5; 7; 8 - 10; 13; 54; 55; 57]. Supplementary section 2.2 provides quotes from Curry illustrating this. Curry not only commented on past and current temperature trends, but also made predictions for the future. The following list summarizes some of her forecasts, with italicized abbreviations for each forecast:
- 2018-not-top-five : Once 2019 began, 2018 would not be one of the top five warmest years in the instrumental (a.k.a. thermometer) record [32].
- Post-1998-flat : Earth's global average surface temperature would remain roughly flat from 1998 until the 2030s [2; 8; 13]. Consistent with this, global warming stopped around 1998, such that there was a lack of warming since 1998 [670; 680].
- Continuing-hiatus : There would be an ongoing hiatus in global warming [5; 9; 14; 57; 1188], with an average temperature trend of less than 0.10°C/decade for 10 more more years [18; 242].
- Continuing-pause : There would be an ongoing pause in global warming [4; 9], with an average temperature trend of less than 0.17°C/decade [97].
- Post-2002-cooling : Climate shifted in 2001/2002 [2; 3], as per claims made by the climate scientist Anastasios Tsonis [190, page 4; 191, paragraphs 14 and 15; 192 - 194]. This shift provides a justification for inferring an ongoing post-2002 cooling trend, not just a post-1998 hiatus [3].
- IPCC-wrong : Post-1997 [677] and post-1998 temperature trends are at odds [7; 98] with a 2007 Intergovernmental Panel on Climate Change (IPCC) forecast of ~0.2°C/decade of warming for the early 21st century [45, page 1010; 159, page 7; 836, section 3.2 on page 45], particularly the first two decades of the 21st century [211; 677]. A similar point applies [18] to a 2013 IPCC forecast of 0.1 - 0.233°C/decade [45, page 1010]. So one should not expect observed warming to match the IPCC's forecasted rate [8; 98].
(A note on continuing-hiatus: Curry's 0.10°C/decade value is meant to represent the minimum trend needed for statistically significant warming [18; 242]. For longer time-periods, the uncertainty range would decrease, such that smaller rates of warming would qualify as statistically significant. For example, a trend 0.05°C/decade would qualify as statistically significant on a time-scale of 40 years, but not on a time-scale of 4 years [35, pages S17 and S18; 76; 615]. This means that as more years pass, Curry's continuing-hiatus forecast would become more likely to fail, since it would require a smaller and smaller average temperature trend. To keep things simple and to give continuing-hiatus a better chance of success, I fixed its value at 0.10°C/decade, even for longer time-periods.)
The IPCC actually projected about 0.2°C/decade of warming for the couple of decades following 2007, across a range of greenhouse gas emission scenarios [45, page 1010; 159, page 7; 160, page 763; 836, section 3.2 on page 45]. Curry therefore should have started the IPCC's trend in 2007 for IPCC-wrong, not 1998 [158, figure S1]. But looking at post-2007 temperature trends would immediately debunk Curry's IPCC-wrong forecast, since every up-to-date surface analysis shows 2007 - 2019 warming of between 0.2°C/decade - 0.4°C/decade [76; 686; 687; 698; 711 - 715, generated using 152, as per 153] (with the exception of an analysis known as CFSR [715, generated using 152, as per 153], who's flaws I discuss later in this section). So in the interest of giving Curry's IPCC-wrong forecast a better chance of succeeding, I will leave its start-point in Curry's chosen years of 1997 [18; 98; 677, with 972], 1998 [7; 13; 18; 98] or 2002 [2; 3], not in 2007.
In response, one could object that the 2007 IPCC projection should start in 2000, since the 2007 IPCC Report's model-based projection uses observed greenhouse gas levels until 1999, before shifting to projected greenhouse gas levels post-2000 [1; 160, pages 762 - 763; 836, pages 44 - 46]. Moreover, some of Curry's claims about the IPCC's projections apply to the first two decades of the 21st century [211; 677, with 972], which would mean the beginning of 2000 to the end of 2019. But starting in 2000 would result in the same problem for Curry's IPCC-wrong forecast with respect to the first two decades of the 21st century [211; 677, with 972]. After all, up-to-date surface analyses show an average warming trend in the range of 0.16°C/decade - 0.23°C/decade [76; 686; 687; 698; 716 - 720, generated using 152, as per 153] for 2000 - 2019 (with the exception of two analyses known as CFSR and MERRA-2 [721], who's flaws I discuss later in this section), thereby rounding, with one significant figure, to 0.2°C/decade. Analyses with greater global coverage show a post-2000 warming trend of 0.18°C/decade or more [76; 686; 687; 716 - 719, generated using 152, as per 153]. Since that result also undermines Curry's IPCC-wrong forecast, I will not start the trends in 2000 either, with the exception of figure 4, in the interest of again giving Curry's forecast a better chance.
Even with these concessions, a problem remains for Curry's chosen start-points: she makes sure to start her trends on, or soon before, unusually warm years such as 1998 [7; 13; 18; 98] and 2002 [2; 3]. During these years [94; 95; 332; 336 and 701, generated using 152, as per 153] the warm El Niño phase of an ocean cycle known as ENSO (the El Niño–Southern Oscillation) temporarily increases global surface temperature [94; 310; 312; 332]. Curry also makes sure to not end her trends on strong El Niño years [2; 3; 7; 13; 18; 98], instead often opting for end-points [2 - 5; 7; 10; 57; 97; 98; 314] on, or soon after [94; 95; 332; 336 and 701, generated using 152, as per 153], ENSO's colder La Niña phase that temporarily decreases global surface temperature [94; 310; 312; 332].
So what Curry does is akin to cherry-picking a start-point at midday in Canada's winter, an end-point at midnight 2 weeks later, and then using that to claim a pause/hiatus in a multi-month Canadian warming trend from winter to summer (to borrow an analogy from potholer54, a.k.a the geologist Peter Hadfield [301, from 5:22 - 11:22]). One could correct for that time-of-day cherry-picking by choosing time-points that both start at midday, just as one could (at least partially) correct for Curry's cherry-picking by selecting a start-point and end-point near similar ENSO conditions. Curry admits this [859], and she was warned of the risk of cherry-picking short time-periods when it came to human-made greenhouse-gas-induced warming [1139]. Figure 8 illustrates the perils of Curry's cherry-picking, as a greenhouse-gas-induced warming effect builds up more on multi-decadal time-scales.
Thus one should expect Curry's misleading cherry-picking of start-points and end-points to skew her temperature trends slightly below [61; 109, section 3.3; 123; 156, page 25; 157; 229, page 162] the IPCC's forecast of ~0.2°C/decade, even if the IPCC forecast matches the underlying, more representative temperature trend; I discuss this further in response to objection 2 in section 2.2. The IPCC itself noted that the 1998 strong El Niño misleadingly skewed shorter-term, post-1998 temperature trends downwards in comparison to longer-term trends [229, page 162].
Even given these points, the IPCC's forecasted post-1998 trend is somewhat similar to their post-2007 trend [1; 45, page 1010 and figure 11.25b on page 1011], and similar to their 2017 - 2040 forecasted trend that applies under conditions in which humans do not greatly limit greenhouse gas emissions [378, figure SPM.1 on page 6]. Other contrarians and myth proponents also give a ~0.2°C/decade trend [212, as per 211, 213, and 214; 215; 217, figure 3; 218, pages 14 - 15; 219; 220, section 3.4; 221; 223; 231; 246, section 3; 1100; 1101] for the IPCC's forecast, just as Curry does [7; 18; 97; 98; 211; 677]. So this blogpost will focus on that trend, while keeping in mind the 0.1 - 0.233°C/decade range Curry gave [18; 232, page 39], along with her definitions of "pause", "hiatus", and her cherry-picked start-points and end-points.
Strangely, Curry abuses the English language in order to manufacture a pause and/or hiatus in warming. She does this by claiming a "hiatus" is a temperature trend of at least 10 years long that is less than 0.10°C/decade [18; 242], a "pause" is a trend of less than 0.17°C/decade, and a "sto[p]" in warming would be a trend of less than or equal to 0.0°C/decade [97]. Thus, for instance, on these definitions continuing-hiatus entails continuing-pause, but not vice versa. Her definitions likely serve to confuse [108; 112] the audience to her "Climate Etc." blog where she makes many of her pause/hiatus claims [2 - 5; 7 - 10; 13; 14; 32; 54; 55; 57], since "pause" and "hiatus" are synonymous with "temporary stop", both in everyday life [121; 168 - 173; 307 - 309] and in much the peer-reviewed literature on temperature trends [109; 112; 120, page 226]. Elsewhere, Curry forecasts a flat temperature trend [2; 8; 13] or cooling [3; 10], with warming likely not resuming until the 2030s [4; 9; 14; 57; 1182, with 1180]. Thus her arbitrary re-definitions of the terms "pause" and "hiatus" do not change the fact that she forecasted an end to warming.
Moreover, a warming rate of less than 0.17°C/decade would hardly constitute a sensible definition of a "pause" with respect to past temperature trends on longer time-scales. Figure 1 below illustrates this point, by comparing a ~0.16°C/decade (~1.6°C per century) warming trend to other warming and cooling trends over the past 2000 years:

Figure 1: Global surface temperature trend over the past 2000 years back to 1 CE, based on instrumental data (thermometers) and reconstructions from indirect, proxy measurements of temperature [24; 25]. The instrumental data extends from 1850 - 2017 [26, figure 1a]. Each trend covers a period of 51 years, stated in units of °C/century, and ends on the year given on the x-axis. The horizontal lines represent the upper range of pre-industrial (pre-1850) warming rates from reconstructions (solid green line) or calculated by climate models (dashed orange line).
This figure is a simplification [24; 25] of a previously published analysis [26, figure 4a].
Multiproxy analyses confirm the instrumental warming trend [386, figure 1c; 387 - 393; 936], as do other indirect measures that do not use thermometer data for air temperatures [388, figure 3; 389, figure 4; 394; 395, generated using 152, as per 153, with the re-analyses from 394 and 396]. For further discussion of industrial-era temperature trends relative to the distant past, see sections 2.5 and 2.7 of "Myth: Attributing Warming to CO2 Involves the Fallaciously Inferring Causation from a Mere Correlation".
The industrial-era warming rate is also large relative to the past ~10,000 years to ~21,000 years [741, page 2; 742, page 9; 743; 744, figures 2A and 2B, citing 745; 746; 747; 904; 933, citing 162, 743, and 745, with 934 (generated using 152, as per 153); 1126, figure 8; 1164; 1173, figure 3]. In the 12 decades from the 1900s to 2010s, Earth's surface warmed by ~1.3°C [76; 162, figure 1; 675; 679, figure 8; 683; 732; 748 - 750 and 1033, generated using 152, as per 153]; ~0.9°C of warming occurred in the 50 years from the beginning of 1970 to the end of 2019 [76; 162, figure 1; 675; 679, figure 8 [with: 1165]; 683; 732; 748 - 751 and 798, generated using 152, as per 153], coinciding with a sharp increase in the rate of human-made, greenhouse-gas-induced warming [37, as per 36; 387; 455; 456; 459; 461; 752 - 754; 755, figure 8.18 on page 699]. And ~1.0°C of global surface warming occurred from 1964 - 2019 at a rate of ~0.17°C/decade [76; 985 - 987, generated using 152, as per 153]. This places us on track for a bit less than 3°C of warming from the 1900s to end of the 21st century [500; 675; 740]. See the third panel of figure 6 for more on this.
Some individuals might mistakenly believe this temperature change is irrelevant, since they experience larger local temperature fluctuations over shorter time periods. But these shorter-term local fluctuations are not comparable to the effect of longer-term global warming. As an analogy [775 - 779]: the surface of a small section of human skin could warm by 5°C for just a short time, without affecting the person's health much. But if a person had a fever where their body warmed by 2.0°C and stayed that way long-term, then that would have a larger effect on their health. Similarly, longer-term global warming can have a larger effect than shorter-term local temperature fluctuations [253; 378; 398; 742, section 17 on page 19; 757, from 30:01 to 32:32; 773; 774; 815, pages 6 - 16; 816, page 17; 817, figure 2 for v007 and figure 88 for v043; 818 - 824; 889; 937; 1025, from 20:55 to 25:15].
For instance, Earth's surface was only about 3.5°C - 5°C cooler over 17,000 years ago relative to the 1800s, during the glacial phase of Earth's ice age [251; 253; 742, page 9; 743; 757, from 30:01 to 32:32; 758, as per 759 and 760; 761 (to be read with 762 - 765); 765, with 766; 768 - 771; 772 (to be read with 837 - 839; 1004; 1005; 1065, from 14:52 to 16:30; 1068 - 1070); 933, citing 162, 743, and 745, with 934 (generated using 152, as per 153); 1025, from 20:55 to 25:15] (remembering that 1°C of warming at high latitudes translates to ~0.6°C of global warming in data for this older period [251, figure 12; 761 (to be read with 762 - 765); 1780]). Moreover, Earth's surface was only 2°C - 3°C warmer than the 2000s during the Middle Pliocene over 2.5 million years ago [766, with 767; 781, section 4.2.1 on page 2295 (along with 782, section 7 on page 1943), citing 783 and 784; 785; 786; 791; 862; 877], resulting in an ice-free Arctic Ocean in the summer [781, section 4.2.1 on page 2295 (along with 782, section 7 on page 1943), citing 783 and 784; 785; 787; 788, page S25, citing 789], along with CO2 levels of around 400ppm [766, with 767; 785; 786; 790 - 793; 862; 877; 878]. Consistent with this, scientists project an ice-free summer for the Arctic Ocean during the mid-to-late 21st century [277; 794 - 798]; CO2 levels are also now above 410ppm [799 - 805], the highest they have been in at least 2 million years [90, pages 11, 31, 53, 133, and 151; 780; 786; 790; 791; 793; 890] and increasing at a rate not seen for tens of millions of years [251; 879 - 882].
So if one accepts Curry's abuse of the English language, then warming of ~1.6°C/century constitutes a "pause" in warming [97], even though that warming rate is almost 3 times larger than the greatest pre-industrial warming rates over the past 2000 years. Thus Curry's ad hoc re-definition of terms such as "pause" and "hiatus" seems setup to cause her audience to under-estimate the relative magnitude of recent warming. And her continuing-pause forecast, even if successful, would therefore not, by itself, imply much about the ongoing global warming trend.
Setting aside Curry's misuse of English, how do her aforementioned listed claims hold up? 2018-not-top-five [32] is false, since 2018 was the fourth warmest year in the instrumental record at the beginning of 2019 [35, pages S5 and S11; 161; 162, section 7.1; 163; 323], as Curry herself later admitted [33]. To assess Curry's other claims, one can use temperature analyses that focus on just instrumental records from thermometers.
Though Curry often casts aspersions on some of these instrumental analyses, especially an analysis from Thomas Karl et al. at the National Oceanic and Atmospheric Administration (NOAA) and an analysis from Kevin Cowtan and Robert Way (Cowtan+Way) [16; 18; 302 - 306], she also expressed confidence in the Berkeley Earth analysis [303; 337]. Curry formerly worked with Berkeley Earth on their analysis [333; 334; 337; 567; 570; 1189] and voiced pleasure in how it turned out [337], though Berkeley Earth's fossil-fuel-industry-funded [564 - 566] results confirmed greenhouse-gas-induced [563; 567, paragraph 29 of section 5, citing 563; 568; 569] warming [162, figure 1; 378, pages 57 - 58; 380; 563; 567; 570]. Curry also conveniently overlooked Berkeley Earth's results when they got in the way of her attempts to manufacture false doubt about surface temperature trends [919 - 924]. In addition to Berkeley Earth, Curry also expressed confidence in the Hadley Climate Research Unit Temperature analysis (HadCRUT) [303]; she relies on HadCRUT4 in her published work [550, section 3.3; 551, section 3c; 552], along other instrumental analyses such as Cowtan+Way [551, section 3c; 552]. So it would still be worthwhile to examine their trends to see if they support or undermine Curry's point.
Let's begin with a few notes on instrumental analyses. The NOAA's surface temperature analysis [60, page 4014; 62, sections 4 and 6; 66, section 3.1; 75, figure 1; 402, cited by 412] and the Japan Meteorological Agency's (JMA) surface analysis [59, section 7.4; 60, page 4014; 402, cited by 412 (with 1050, figure 1.1-2 on page 14); 608, section 2b on page 4681] under-estimate recent warming due to their poorer coverage of the globe, though more recent work shows improved coverage in the NOAA analysis [609; 679]. The HadCRUT4 surface analysis from the Hadley Centre of the United Kingdom Met Office and the Climatic Research Unit (CRU) of the University of East Anglia, also under-estimates warming due to poorer coverage [52; 61; 62, section 4; 63, figure 1, sections 4.2.2 and 4.2.3; 64 - 74; 378, page 57; 380; 402, cited by 412; 608, section 2b on page 4681], as admitted by members of the Hadley Centre team [70]. In particular, HadCRUT4 [52; 61 - 74; 378, page 57; 380; 402], NOAA [60, page 4014; 62, sections 4 and 6; 66, section 3.1; 75, figure 1; 402], and JMA [59, section 7.4; 60, page 4014; 402, cited by 412 (with 1050, figure 1.1-2 on page 14); 608, section 2b on page 4681] each under-estimate surface warming in the Arctic, one of the most rapidly warming regions on Earth [52; 65; 177; 390; 403, figure 2; 404 - 406; 1024; 1085; 1086], which contributes to these analyses under-estimating global warming. Berkeley Earth also under-estimates Arctic warming [73; 1024], but to a lesser extent.
The instrumental analyses also differ in the datasets they use for sea surface temperature. There are at least three datasets: Extended Reconstructed Sea Surface Temperature (ERSST), Hadley Centre Sea Surface Temperature (HadSST), and Centennial Observation-Based Estimates of Sea Surface Temperature (COBE-SST) [433; 434; 437; 1006; 1007]. These sea surface temperature analyses are used in the following instrumental analyses [66, table 1; 608, section 2; 679 (with: 1165); 983, table 1; 1019]:
- COBE-SST : JMA
- HadSST : HadCRUT4 , Cowtan+Way , Berkeley Earth
- ERSST : NOAA , GISTEMP , CMST
(NASA's GISTEMP = National Aeronautics and Space Administration's {NASA's} Goddard Institute for Space Studies Surface Temperature analysis ;
CMA's CMST = China Meteorological Administration's {CMA's} China Merged Surface Temperature analysis)
Another global instrumental surface analysis known as HadOST uses air temperature data above land from Cowtan+Way, with sea surface temperature data from the Hadley Centre Sea Ice and Sea Surface Temperature analysis (HadISST2) and the Operational Sea Surface Temperature and Sea Ice Analysis (OSTIA) [36, page 4895; 37; 428; 1117, with 1118]. Figure 8 below shows results from HadOST, though monthly values from HadOST are not yet available up to 2019 [1098, from 1099]. So HadOST was not included in the figures shown in this paper.
The most recent versions of COBE-SST and ERSST show about the same amount of sea surface warming for the time-periods examined in this blogpost [433; 434; 1006; 1008 and 1009, generated using 152, as per 153]. However, HadSST3, the older version of HadSST, shows less warming and under-estimates recent warming [38, table 1; 50, compared to 51 and 601; 66, section 3.1; 437, with 571 and 1010], as discussed in section 2 of "Myth: Karl et al. of the NOAA Misleadingly Altered Ocean Temperature Records to Increase Global Warming". HadSST4, the update to HadSST4, corrects this issue, confirming the warming trend from the most recent versions of ERSST [437, with 571 and 1010]. Given this update, the instrumental analyses that still use HadSST3 will under-estimate recent warming; this applies to Berkeley Earth [66, section 3.1; 983, table 1; 1019 - 1021] and HadCRUT4 [66, section 3.1; 983, table 1; 1019; 1022; 1023], both of which still use HadSST3. To illustrate this point, I have included a Cowtan+Way analysis using HadSST3 and another Cowtan+Way analysis using HadSST4 ("Cowtan+Way" [61; 68; 893, from 892] and "C+W with HadSST4" [36; 571; 891, from 892], respectively). Interestingly, Curry objected to ERSSTv4 by calling HadSST3 the "gold standard dataset [303]" for recent warming, while praising the work of the HadSST team. She will presumably now need to reconcile her comments with the HadSST team validating ERSSTv4 [437, section 5.4] and admitting that HadSST3 under-estimated recent warming [437, with 571 and 1010].
And as a final note: over the oceans, observational analyses use temperature trends for the surface water [63, section 2.3.2; 158, "Methods" section; 378, page 57; 380; 599; 600; 883 (with 732)], while the IPCC's model-based projection uses temperature trends for the air above the water [45, page 955 and figure 11.25 on page 1011; 63, section 2.3.2; 158, "Methods" section; 160, pages 749, 762, and 763; 378, page 57; 380; 599; 600; 883 (with 732)]. Several papers show that performing a more accurate comparison using the same metric (surface water trends) for both the projections and observational analyses, would decrease the model-based projected warming trend by about 7% or increase the observational analyses' warming trend [63, section 2.3.2; 158, "Methods" section; 378, page 57; 380; 599; 600; 883 (with 732)], though one paper disputes this point [601; figures 12, 13, and table 1]. However, this blogpost's analysis will not include this more accurate comparison. The absence of this comparison actually benefits Curry's IPCC-wrong forecast, since it keeps the model-based warming projection larger and thus gives the IPCC's projection a better chance of over-estimating warming [63, section 2.3.2; 158, "Methods" section; 378, page 57; 380; 571; 599; 600; 883 (with 732)]. So if her forecast fails even with this factor unfairly weighted in its favor, then it truly lacks merit.
With these points in mind, figure 2 below compares global surface temperature trends from instrumental analyses, to Curry's forecasts [2 - 5; 8; 9; 13; 14; 18; 57; 97; 242] and to the IPCC's forecast [45, page 1010; 159, page 7; 836, section 3.2 on page 45] Curry objected to [7; 8; 18; 98]:


Figure 2: Comparison of global surface temperature trends from instrumental analyses [76; 694 - 697, generated using 152, as per 153; 698], vs. temperature trend forecasts offered by Judith Curry and the United Nations Intergovernmental Panel on Climate Change (IPCC). The IPCC projections are ~0.2°C/decade [45, page 1010; 159, page 7; 836, section 3.2 on page 45] and 0.1 - 0.233°C/decade [45, page 1010], as per the IPCC's 2007 Fourth Assessment Report [45, page 1010; 159, page 7; 836, section 3.2 on page 45] and 2013 Fifth Assessment Report [45, page 1010], respectively. Curry objects to the accuracy of both projections [7; 8; 18; 98]. Curry's forecasts are for a "pause" [4; 9] of <0.17°C/decade [97] and a "hiatus" [5; 9; 14; 57; 1188] of <0.10°C/decade [18; 242], along with a post-1998 "flat" trend [2; 8; 13] and post-2002 cooling [2; 3] (treated here as being 0.0°C/decade and any negative temperature trend, respectively). The trend for C+W with HadSST4 goes to the end of 2018, not 2019 [76; 571; 891, from 892; 1021]; as noted earlier in this section, it is meant to act as a comparison to the Cowtan+Way analysis that uses HadSST3.
The instrumental analyses are: the Berkeley Earth Surface Temperature analysis [380; 563] ; the Goddard Institute for Space Studies Surface Temperature analysis version 4 (GISTEMPv4) from NASA [162] ; HadCRUT4 from the Hadley Centre of the United Kingdom Met Office and the Climatic Research Unit of the University of East Anglia [59] ; Kevin Cowtan and Robert Way's updates of HadCRUT4 [61; 68; 893, from 892] with sea surface temperature data-sets such as Hadley Sea Surface Temperature version 4 (HadSST4) [36; 571; 891, from 892] ; the NOAA's global analysis [75; 572; 609; 887] ; and the Japan Meteorological Agency's global analysis (JMA) [59; 60]. The China Meteorological Agency (CMA) also offers global instrumental analysis with greater coverage [679; 685; 1165], but this CMST analysis currently extends to 2018, not 2019 [685 (later: 1165)]. Its 1998 - 2018 and 2002 - 2018 trends are both 0.18°C/decade [685]. Scientists will likely introduce more instrumental surface analyses in the future; this includes the upcoming GloSAT analysis, which is intended to cover global surface air trends dating back to the late 1700s [571; 913 - 917].
HadCRUT4 and Berkeley Earth both use sea surface temperature trends from the Hadley Centre Sea Surface Temperature analysis (HadSST) [608, section 2; 679; 983, table 1]. HadSST3, an older version of HadSST, under-estimates recent warming [38, table 1; 50, compared to 51 and 601; 66, section 3.1; 437, with 571 and 1010]; the update to HadSST3, HadSST4, fixes this issue [437, with 571 and 1010]. So analyses that still use HadSST3 will under-estimate recent warming. This applies to Berkeley Earth [66, section 3.1; 983, table 1; 1019 - 1021] and HadCRUT4 [66, section 3.1; 983, table 1; 1019; 1022; 1023], both of which still use HadSST3. Berkeley Earth also under-estimates Arctic warming [73; 1024].
The IPCC 2018 Special Report presents warming trends from Berkeley Earth, GISTEMP, Cowtan+Way, NOAA, HadCRUT4, and JMA [378, pages 57 - 58]. Judith Curry's published work cites trends from HadCRUT [550, section 3.3; 551, section 3c; 552], Cowtan+Way [551, section 3c; 552], GISTEMP [551, section 3c], and NOAA [551, section 3c]. Curry further reported confidence in the Berkeley Earth [303; 337] and HadCRUT analyses [303]; she formerly worked with Berkeley Earth on their analysis [333; 334; 337] and expressed pleasure in how it turned out [337]. Interestingly, Curry called HadSST3 the "gold standard dataset [303]" for recent warming, while praising the work of the HadSST team. She will presumably now need to reconcile her comments with the HadSST team admitting that HadSST3 under-estimated recent warming [437, with 571 and 1010].
In addition to the aforementioned instrumental analyses, one can also use a source known as the European Centre for Medium-Range Weather Forecasts' (ECMWF) Interim re-analysis (ERA-I). This re-analysis combines a diverse range of data, including surface temperature records, satellite analyses, etc. [175; 178 - 182]. I chose this re-analysis since Curry lauds re-analyses in general [16; 18 - 20; 681; 925; 927], especially [18; 20; 681; 925; 927] ERA-I, ERA-I's update ERA5 [35, pages S18 - S19; 178 - 182; 1166], and ECMWF's work [18; 20; 681; 925; 927], as shown in supplementary section 2.1. Furthermore, contrarians such as John Christy [35, pages S17 and S18; 384, pages S16 and S17; 603; 604, pages 4 - 7; 605; 606; 607, page 104], Roy Spencer [606; 610; 611; 900], Roger Pielke Sr. [603; 612; 613], Anthony Watts [619], Patrick Michaels [614; 615], Javier [620], and David Evans [621 - 623] also cite re-analyses.
But what about re-analyses other than ERA-I and ERA-5? The National Aeronautics and Space Administration's Modern-Era Retrospective Analysis for Research and Applications (NASA's MERRA-2) [49, figure 8 on page 5654; 62, sections 2.2, 7.1, and 7.3; 162; 177, figure 7a; 399, section 7 on page 5445; 651; 652; 988, using 52] and the National Centers for Environmental Prediction's Climate Forecast System Re-analysis (NCEP's CFSR) [150, figure 4a on page 2293; 175, figure 18 on page 14622] are outlier re-analyses that conflict with both surface-based analyses and satellite-based analyses. In the case of MERRA-2, the MERRA-2 team notes that MERRA-2's outlier status may result from flaws in the re-analysis [399, section 7 on page 5445; 651; 652]. It may also stem from MERRA-2 only using weather balloon data for land surface trends, instead of other data sources [62, section 7.1; 162, section 5.1.1; 400, section 2c on page 5; 401]. Evidence from satellite-based analyses suggests that an erroneous shift or discontinuity occurred in MERRA-2 in 2007/2008 [49, figure 8 on page 5654; 988, pages 5 and 14, using 52]. Consistent with this, MERRA-2 shows about as much global warming as ERA5 up until 2006, while showing less warming afterwards [989 - 991, generated using 152, as per 153]. And just as with HadCRUT4 [52; 61 - 74; 378, page 57; 380; 402], NOAA [60, page 4014; 62, sections 4 and 6; 66, section 3.1; 75, figure 1; 402], and JMA [59, section 7.4; 60, page 4014; 402, cited by 412 (with 1050, figure 1.1-2 on page 14); 608, section 2b on page 4681], MERRA-2 [62, section 7.1; 177, figure 7a; 399, section 7 on page 5445; 651; 652] under-estimates surface warming in the Arctic, which contributes to MERRA-2 under-estimating global warming.
Even the contrarian Ryan Maue [21], who Curry agrees with when it comes to re-analyses [16], recommends using ERA5 [21; 239] and the Japan Meteorological Agency's 55-year Re-analysis (JRA-55) [21; 239; 614; 615; 618] instead of MERRA-2 [21] or CFSR [21; 239]. This is because, according to Maue [239; 240, citing 407] and other sources [407; 408, page 204; 411, pages 1 and 2; 658], CFSR's data processing model changed in 2011, such that pre-2011 CFSR results were not comparable to post-2011 results. Maue speaks from experience when he discusses CFSR's problems, since he previously produced a graph of surface trends from the erroneous CFSR analysis. The Global Warming Policy Foundation (GWPF) [22; 23] then used Maue's dubious CFSR graph to claim no recent global warming occurred; this fits with GWPF's role as a politically-motivated contrarian organization [485; 638 - 643] Tsonis [635] joined and on who's behalf Curry [636; 637] (and Tsonis [190]) wrote non-peer-reviewed contrarian reports. GWPF later admitted Maue's CFSR graph was wrong [22; 23], with contrarians such as [653 - 657] Roy Spencer [611; 900], Joe Bastardi [429; 598], Anthony Watts [430; 431], and Pierre Gosselin [598] peddling the debunked graph or other similar CFSR analyses.
Thus those who rely on CFSR for surface trends do so that their own risk. Curry herself notes that CFSR conflicts with conventional analyses, including ERA-I; when discussing this, she remains inclined towards ERA-I [18]. And the scientists working on CFSR originally meant it to extend until 2009 [590; 592], supporting the idea that its trends through and past 2009 may be erroneous. Consistent with this, CFSR shows about a third more warming than ERA5 from 1990 - 2009 [409, generated using 152, as per 153] and ~17% more warming from 1998 - 2009 [593, generated using 152, as per 153], while showing substantially less warming after 2009 [410, generated using 152, as per 153]. The discontinuity in CFSR's model in 2010 or 2011 [239; 240, citing 407; 408, page 204; 411, pages 1 and 2; 658] may explain why the KNMI data repository includes CFSR results only up until about 2010, while extending other sources such as ERA-I and ERA-5 to post-2010 [238].
One can also assess CFSR and MERRA-2 via two re-analyses that do not use land-based thermometer data: the National Oceanic and Atmospheric Administration's 20th Century Re-analysis (20CR) [388; 394; 722; 1115] and the European Centre for Medium-Range Weather Forecasts' Atmospheric Reanalysis of the 20th century (ERA-20C) [388; 396; 1116]. In comparison to 20CR and ERA-20C, CFSR displays about as much [992, using 152, as per 153], or less [993, using 152, as per 153], global warming up to 2009, before CFSR's 2010/2011 shift [239; 240, citing 407; 408, page 204; 411, pages 1 and 2; 658]. And MERRA-2 shows about as much [994, using 152, as per 153], or less [995, using 152, as per 153], global warming up to 2006, before MERRA-2's 2007/2008 discontinuity [49, figure 8 on page 5654; 988, pages 5 and 14, using 52]. One can also compare these re-analyses to CERA-20C, ECMWF's Coupled Reanalysis of the 20th Century [1026 - 1028] that resulted from ERA-CLIM2 [1026; 1031; 1032, section 2.1.1 on pages 2 - 3], a process Judith Curry called true progress [20, citing 1032; 1034]. CERA-20C also shows more warming than both MERRA-2 [1029, using 152, as per 153] and CFSR [1030, using 152, as per 153], up to the 2009 period CERA-20C covers.
So MERRA-2 and CFSR likely do not significantly over-estimate global warming before their respective erroneous shifts, despite their having pre-shift warming trends on par with ERA5 [593 and 990, generated using 152, as per 153]. Resolving the MERRA-2 [49, figure 8 on page 5654; 988, pages 5 and 14, using 52] and CFSR [239; 240, citing 407; 408, page 204; 411, pages 1 and 2; 658] discontinuities would therefore likely further support ERA-5's warming trend. These discontinuities also appear in their respective comparisons to 20CR [996 and 997, using 152, as per 153], further confirming the existence of these errors in MERRA-2 [49, figure 8 on page 5654; 988, pages 5 and 14, using 52] and CFSR [239; 240, citing 407; 408, page 204; 411, pages 1 and 2; 658] (CERA-20C and ERA-20C do not extend far enough into the 2010s [238; 723 and 1033, generated using 152, as per 153] to be helpful in detecting the aforementioned discontinuities).
Finally, JRA-55 uses sea surface temperature trends from COBE-SST [62, section 2.2; 582, page 18; 583, page 150]. COBE-SST2, the update to COBE-SST, shows greater warming than COBE-SST [1006, figure 8; 1062, generated using 152, as per 153 (with 1063)], consistent with ERSSTv4 [433; 434; 1006; 1008 and 1009, generated using 152, as per 153] and other sea surface temperature analyses [38, table 1; 50, compared to 51 and 601; 66, section 3.1; 437, with 571 and 1010]. So JRA-55 likely under-estimates global warming in virtue of using COBE-SST. The Japanese Reanalysis for Three Quarters of a Century (JRA-3Q), the planned update to JRA-55, will address this issue by using [1060; 1061] COBE-SST2 and MGDSST (Merged satellite and in situ data Global Daily Sea Surface Temperature [1141; 1142]) for sea surface temperature trends. ERA-I also under-estimates recent warming due to issues in its SST analysis, as admitted by the ERA-I team [62, section 2.2] and Judith Curry [552, page 401].
Taken together, these points imply that the CFSR, MERRA-2, JMA, HadCRUT4, JRA-55, NOAA, and ERA-I trends (in order from lowest reliability to highest reliability for recent surface trends) should carry less weight than the other analyses. Figure 3 below compares re-analyses' global surface temperature trends, to Curry's forecasts [2 - 5; 8; 9; 13; 14; 18; 57; 97; 242] and to the IPCC's forecast [45, page 1010; 159, page 7; 836, section 3.2 on page 45] Curry objected to [7; 8; 18; 98]:


Figure 3: Comparison of global surface temperature trends from re-analyses [686; 687; 688 - 693, generated using 152, as per 153], vs. temperature trend forecasts offered by Judith Curry and the United Nations Intergovernmental Panel on Climate Change (IPCC). The IPCC projections are ~0.2°C/decade [45, page 1010; 159, page 7; 836, section 3.2 on page 45] and 0.1 - 0.233°C/decade [45, page 1010], as per the IPCC's 2007 Fourth Assessment Report [45, page 1010; 159, page 7; 836, section 3.2 on page 45] and 2013 Fifth Assessment Report [45, page 1010], respectively. Curry objects to the accuracy of both projections [7; 8; 18; 98]. Curry's forecasts are for a "pause" [4; 9] of <0.17°C/decade [97] and a "hiatus" [5; 9; 14; 57; 1188] of <0.10°C/decade [18; 242], along with a post-1998 "flat" trend [2; 8; 13] and post-2002 cooling [2; 3] (treated here as being 0.0°C/decade and any negative temperature trend, respectively). Post-1997 trends tell a similar story [76; 686; 687; 698; 869 - 873, generated using 152, as per 153], with a trend of 0.17°C/decade or more, rounded to two significant figures, for non-outlier re-analyses [686; 687; 871 and 872, generated using 152, as per 153].
The re-analyses are: the European Centre for Medium-Range Weather Forecasts' Re-analysis 5 (ERA5) [35, pages S18 - S19; 178 - 182; 1166], which serves as the recent update to the European Centre for Medium-Range Weather Forecasts' (ECWMF's) Interim re-analysis (ERA-I) [35, pages S18 - S19; 178 - 182; 1166] ; the Japan Meteorological Agency's 55-year Re-analysis (JRA-55) [581 - 584] ; the National Centers for Environmental Prediction's Reanalysis-2 (NCEP-2) [585; 586] ; NASA's Modern-Era Retrospective Analysis for Research and Applications (MERRA-2) [587; 588] ; and the National Centers for Environmental Prediction's Climate Forecast System Re-analysis (CFSR) [589 - 592].
The NOAA's 20th Century Re-analysis (20CR) [388; 394; 722; 1115], along with the European Centre for Medium-Range Weather Forecasts' Atmospheric Reanalysis of the 20th century [388; 396; 1116] and their Coupled Reanalysis of the 20th Century [1026 - 1028] (ERA-20C and CERA-20C, respectively) do not currently reach up to 2016 [238; 723 and 1033, generated using 152, as per 153], and thus were not included in this figure.
The IPCC 2018 Special Report presents warming trends from ERA-I and JRA-55 [378, pages 57 - 58]. Curry recommends using re-analyses in general [16; 18 - 20; 681; 925; 927], while lauding ERA-I, ERA5, and ECMWF's work [18; 20; 681; 925; 927].
Finally, JRA-55 uses sea surface temperature trends from COBE-SST [62, section 2.2; 582, page 18; 583, page 150]. COBE-SST2, the update to COBE-SST, shows greater warming than COBE-SST [1006, figure 8; 1062, generated using 152, as per 153 (with 1063)], consistent with ERSSTv4 [433; 434; 1006; 1008 and 1009, generated using 152, as per 153] and other sea surface temperature analyses [38, table 1; 50, compared to 51 and 601; 66, section 3.1; 437, with 571 and 1010]. So JRA-55 likely under-estimates global warming in virtue of using COBE-SST. The Japanese Reanalysis for Three Quarters of a Century (JRA-3Q), the planned update to JRA-55, will address this issue by using COBE-SST2 and MGDSST for sea surface temperature trends [1060; 1061]. ERA5 shows more warming than ERA-I, likely due to flaws in ERA-I's sea surface temperature analysis, as admitted by the ERA-I team [62, section 2.2] and Judith Curry [552, page 401].
The outlier status of MERRA-2 [49, figure 8 on page 5654; 62, sections 2.2, 7.1, and 7.3; 162; 177, figure 7a; 399, section 7 on page 5445; 651; 652; 988, using 52] and CFSR [150, figure 4a on page 2293; 175, figure 18 on page 14622] stem largely from MERRA-2 under-estimating warming [62, section 7.1; 177, figure 7a; 399, section 7 on page 5445; 651; 652] in the rapidly warming Arctic [52; 65; 177; 390; 403, figure 2; 404 - 406; 1024; 1085; 1086], and CFSR shifting the model it uses to assimilate data in 2010 or 2011 [239; 240, citing 407; 408, page 204; 411, pages 1 and 2; 658]; the scientists working on CFSR originally meant it to extend until 2009 [590; 592]. Consistent with this, CFSR shows ~17% more warming than ERA5 from 1998 - 2009 [593, generated using 152, as per 153], while showing substantially less warming afterwards [594, generated using 152, as per 153]. Similarly, evidence from satellite-based analyses suggests that an erroneous shift or discontinuity occurred in MERRA-2 in 2007/2008 [49, figure 8 on page 5654; 988, pages 5 and 14, using 52]. Consistent with this, MERRA-2 shows about as much global warming as ERA5 up until 2006, while showing less warming afterwards [989 - 991, generated using 152, as per 153]. So resolving MERRA-2's and CFSR's shifts would likely further support the IPCC's projected trend and undermine Curry's forecast.
In comparison to the 20CR [388; 394; 722; 1115] and ERA-20C [388; 396; 1116] re-analyses that do not use land-based thermometer data, MERRA-2 displays about as much [994, using 152, as per 153], or less [995, using 152, as per 153], global warming up to 2006; CFSR displays about as much [992, using 152, as per 153], or less [993, using 152, as per 153], global warming up to 2009. This further supports the idea neither MERRA-2 nor CFSR significantly over-estimate global warming before their respective erroneous shifts, despite their having pre-shift warming trends on par with ERA5 [593 and 990, generated using 152, as per 153]. The 2007/2008 MERRA-2 [49, figure 8 on page 5654; 988, pages 5 and 14, using 52] and 2010/2011 CFSR [239; 240, citing 407; 408, page 204; 411, pages 1 and 2; 658] discontinuities also appear in their respective comparisons to 20CR [996 and 997, using 152, as per 153], further confirming the existence of these discontinuities (ERA-20C and CERA-20C [238; 723 and 1033, generated using 152, as per 153] do not extend far enough into the 2010s to be helpful in detecting the aforementioned discontinuities).
One might complain that the temperature trends from figures 2 and 3 lack error bars. But that objection does not help Curry's case, since she focuses on the average trend when determining whether a pause/hiatus occurred [18; 97], as figures 2 and 3 do. Moreover, appealing to error bars would undermine Curry's position, since, for instance, most of the error bars would comfortably overlap with the IPCC's forecast of ~0.2°C/decade, undermining her IPCC-wrong forecast. Conversely, note that the error bars would not save Curry's continuing-hiatus and continuing-pause predictions, since those predictions required that the average temperature trend be less than 0.10°C/decade [18; 242] and 0.17°C/decade [97], respectively, not that the errors bars failed to overlap with trends of 0.10°C/decade and 0.17°C/decade.
Take, for example, the 1997 - 2019 warming trends shown below, with +/- 2σ statistical uncertainty (in °C/decade; the trend for "C+W with HadSST4" ends in 2018, not 2019 [76; 571; 891, from 892; 1021]):
- Berkeley Earth [380; 563] : 0.19 +/- 0.08 [76; 573; 894]
- GISTEMPv4 [162] : 0.21 +/- 0.09 [76; 322; 574]
- Cowtan+Way [61; 68; 893, from 892] : 0.18 +/- 0.08 [76; 575; 893, from 892; 895]
- C+W with HadSST4 [36; 571; 891, from 892] : 0.19 +/- 0.09 [76; 575; 576; 891, from 892]
- NOAA [75; 572; 609; 887] : 0.18 +/- 0.10 [76; 577; 578]
- HadCRUT4 [59] : 0.14 +/- 0.08 [76; 579; 580]
Corresponding 1998 - 2019 warming trends are shown below, with +/- 2σ statistical uncertainty (in °C/decade; the trend for "C+W with HadSST4" ends in 2018, not 2019 [76; 571; 891, from 892; 1021]):
- Berkeley Earth [380; 563] : 0.19 +/- 0.08 [76; 573; 894]
- GISTEMPv4 [162] : 0.22 +/- 0.10 [76; 322; 574]
- Cowtan+Way [61; 68; 893, from 892] : 0.18 +/- 0.09 [76; 575; 893, from 892; 895]
- C+W with HadSST4 [36; 571; 891, from 892] : 0.19 +/- 0.09 [76; 575; 576; 891, from 892]
- NOAA [75; 572; 609; 887] : 0.19 +/- 0.10 [76; 577; 578]
- HadCRUT4 [59] : 0.14 +/- 0.09 [76; 579; 580]
Below are 2000 - 2019 warming trends, with +/- 2σ statistical uncertainty (in °C/decade; the trend for "C+W with HadSST4" ends in 2018, not 2019 [76; 571; 891, from 892; 1021]):
- Berkeley Earth [380; 563] : 0.21 +/- 0.09 [76; 573; 894]
- GISTEMPv4 [162] : 0.23 +/- 0.11 [76; 322; 574]
- Cowtan+Way [61; 68; 893, from 892] : 0.19 +/- 0.10 [76; 575; 893, from 892; 895]
- C+W with HadSST4 [36; 571; 891, from 892] : 0.21 +/- 0.10 [76; 575; 576; 891, from 892]
- NOAA [75; 572; 609; 887] : 0.21 +/- 0.12 [76; 577; 578]
- HadCRUT4 [59] : 0.16 +/- 0.10 [76; 579; 580]
And below are corresponding 2002 - 2019 warming trends, with +/- 2σ statistical uncertainty (in °C/decade; the trend for "C+W with HadSST4" ends in 2018, not 2019 [76; 571; 891, from 892; 1021])
- Berkeley Earth [380; 563] : 0.19 +/- 0.11 [76; 573; 894]
- GISTEMPv4 [162] : 0.22 +/- 0.13 [76; 322; 574]
- Cowtan+Way [61; 68; 893, from 892] : 0.18 +/- 0.12 [76; 575; 893, from 892; 895]
- C+W with HadSST4 [36; 571; 891, from 892] : 0.19 +/- 0.12 [76; 575; 576; 891, from 892]
- NOAA [75; 572] : 0.20 +/- 0.14 [76; 577; 578]
- HadCRUT4 [59] : 0.15 +/- 0.11 [76; 579; 580]
(The uncertainty estimates decrease once one takes a pooled average of the analyses [35, pages S17 and S18; 384, page S16]. The statistical uncertainty is smaller for the 1997 - 2019 trends than for the 2002 - 2019 trends, as one would expect with a larger sample size [76; 152, as per 153]. So as time progresses beyond 2019, the statistical uncertainty for the post-1998 and post-2002 trends should decrease further.)
Alternatively, one might be tempted to note that, for example, CFSR, MERRA-2, JMA, and HadCRUT4 substantially differ from the IPCC's trend of ~0.2°C/decade [45, page 1010; 159, page 7; 160, page 76; 836, section 3.2 on page 45]. But cherry-picking these analyses would run fall afoul of the aforementioned notes, such as CFSR's model shift in 2011 [239; 240, citing 407; 408, page 204; 411, pages 1 and 2; 658], the poorer global coverage of JMA [59, section 7.4; 60, page 4014; 402, cited by 412 (with 1050, figure 1.1-2 on page 14); 608, section 2b on page 4681] and HadCRUT4 [52; 61; 62, section 4; 63, figure 1, sections 4.2.2 and 4.2.3; 64 - 74; 378, page 57; 380], and Maue's advice to opt for ERA5 [21; 239] and JRA-55 [21; 239; 614; 615; 618] over MERRA-2 [21] and CFSR [21; 239] (remembering that Curry agrees with Maue on re-analyses [16]). When one moves beyond this cherry-picking of a minority of the analyses, the majority of analyses, particularly those with greater coverage, contradict Curry's forecasts of post-1998-flat [2; 8; 13], continuing-hiatus [5; 9; 14; 57; 1188], continuing-pause [4; 9], post-2002-cooling [2; 3], and IPCC-wrong [8; 98], as per figures 2 and 3.
One should also remember that Curry approved of at least 4 analyses: Berkeley Earth [303; 337], HadCRUT4 [303], and ECMWF's work in ERA-I and ERA5 [18; 20; 681; 925; 927]. As Curry stated in February 2020:
"For trends in global temperature, I much prefer reanalyses such as ERA5, with the obvious caveat that this record only goes back to 1980 (soon to go back to 1950) [925]."
None of the aforementioned 4 analyses support post-1998-flat [2; 8; 13], continuing-hiatus [5; 9; 14; 57; 1188], and post-2002 cooling [2; 3], as per figures 2 and 3. And only HadCRUT4, with its poorer global coverage [52; 61; 62, section 4; 63, figure 1, sections 4.2.2 and 4.2.3; 64 - 74; 378, page 57; 380], supports continuing-pause [4; 9]. Figure 4 below illustrates this point by focusing on the analyses Curry approved of:

Figure 4: Comparison of global surface temperature trends from observational analyses [76; 686; 687; 692 - 695, 717, 718, 720, and 869 - 871, generated using 152, as per 153], vs. temperature trend forecasts offered by Judith Curry and the United Nations Intergovernmental Panel on Climate Change (IPCC). The IPCC projection is 0.1 - 0.233°C/decade [45, page 1010] from the IPCC's 2013 Fifth Assessment Report [45, page 1010], who's range includes a ~0.2°C/decade post-2007 projection from the IPCC's 2007 Fourth Assessment Report [45, page 1010; 159, page 7; 836, section 3.2 on page 45]. Curry objects to the accuracy of both projections [7; 8; 18; 98]. She notes the 2007 IPCC projection covers the first two decades of the 21st century [211; 677, with 972]; this 2007 model-based projection uses observed greenhouse gas levels until 1999, before shifting to projected greenhouse gas levels post-2000 [1; 160, pages 762 - 763; 836, pages 44 - 46]. Hence the inclusion of the 2000 - 2019 time-period, covering the first two decades of the 21st century. Curry also discusses post-1997 trends [18; 98; 677, with 972], using them to object to the IPCC's 2007 projection [677, with 972]. Curry's depicted forecast is for a "hiatus" [5; 9; 14; 57; 1188] of <0.10°C/decade [18; 242], who's range includes her forecasts of a post-1998 "flat" trend [2; 8; 13] and post-2002 cooling [2; 3] (treated here as being 0.0°C/decade and any negative temperature trend, respectively). Error bars are not included for the comparisons to Curry's forecasts, since she focuses on the average temperature trend [18; 97], not what is encompassed by the uncertainty range. For examples of error bars for the Berkeley Earth and HadCRUT4 analyses [76], see earlier in this section.
This figure depicts results from two re-analyses and two instrumental analyses. The re-analyses are the European Centre for Medium-Range Weather Forecasts' Re-analysis 5 (ERA5) [35, pages S18 - S19; 178 - 182; 1166], which serves as the recent update to the European Centre for Medium-Range Weather Forecasts' (ECWMF's) Interim re-analysis (ERA-I) [35, pages S18 - S19; 178 - 182; 1166]. The instrumental analyses are the Berkeley Earth Surface Temperature analysis [380; 563], and HadCRUT4 from the Hadley Centre of the United Kingdom Met Office and the Climatic Research Unit of the University of East Anglia [59].
HadCRUT4 under-estimates recent warming due to its poorer coverage of the globe [52; 61; 62, section 4; 63, figure 1, sections 4.2.2 and 4.2.3; 64 - 74; 378, page 57; 380; 402, cited by 412; 608, section 2b on page 4681], as admitted by members of the Hadley Centre team [70]; in particular, HadCRUT4 under-estimates warming in the Arctic [52; 61 - 74; 378, page 57; 380; 402], one of the most rapidly warming regions on Earth [52; 65; 177; 390; 403, figure 2; 404 - 406; 1024; 1085; 1086]. This contributes to HadCRUT4 showing less warming than the other analyses depicted in this figure. Berkeley Earth also under-estimates Arctic warming [73; 1024], but to a lesser extent. HadCRUT4 and Berkeley Earth both use sea surface temperature trends from the Hadley Centre Sea Surface Temperature analysis (HadSST) [608, section 2; 679; 983, table 1]. HadSST3, an older version of HadSST, under-estimates recent warming [38, table 1; 50, compared to 51 and 601; 66, section 3.1; 437, with 571 and 1010]; the update to HadSST3, HadSST4, fixes this issue [437, with 571 and 1010]. So analyses that still use HadSST3 will under-estimate recent warming. This applies to Berkeley Earth [66, section 3.1; 983, table 1; 1019 - 1021] and HadCRUT4 [66, section 3.1; 983, table 1; 1019; 1022; 1023], both of which still use HadSST3. And ERA5 shows more warming than ERA-I, likely due to flaws in ERA-I's sea surface temperature analysis, as admitted by the ERA-I team [62, section 2.2] and Judith Curry [552, page 401].
The IPCC 2018 Special Report presents warming trends from ERA-I, Berkeley Earth, and HadCRUT4 [378, pages 57 - 58]. Curry recommends using re-analyses in general [16; 18 - 20; 681; 925; 927], while lauding ERA-I, ERA5, and ECMWF's work [18; 20; 681; 925; 927]. Curry further reported confidence in the Berkeley Earth [303; 337] and HadCRUT analyses [303]; she formerly worked with Berkeley Earth on their analysis [333; 334; 337] and expressed pleasure in how it turned out [337]. And in her published work she cites trends from HadCRUT4 [550, section 3.3; 551, section 3c; 552]. Interestingly, Curry called HadSST3 the "gold standard dataset [303]" for recent warming, while praising the work of the HadSST team. She will presumably now need to reconcile her comments with the HadSST team admitting that HadSST3 under-estimated recent warming [437, with 571 and 1010].
Section 2.1: Sources Curry Lauds Debunk Her Temperature Trend Predictions
For the better part of a decade, the climate scientist Judith Curry claimed global warming underwent a pause or a hiatus [4; 5; 7; 8 - 10; 13; 54; 55; 57]. Supplementary section 2.2 provides quotes from Curry illustrating this. Curry not only commented on past and current temperature trends, but also made predictions for the future. The following list summarizes some of her forecasts, with italicized abbreviations for each forecast:
- 2018-not-top-five : Once 2019 began, 2018 would not be one of the top five warmest years in the instrumental (a.k.a. thermometer) record [32].
- Post-1998-flat : Earth's global average surface temperature would remain roughly flat from 1998 until the 2030s [2; 8; 13]. Consistent with this, global warming stopped around 1998, such that there was a lack of warming since 1998 [670; 680].
- Continuing-hiatus : There would be an ongoing hiatus in global warming [5; 9; 14; 57; 1188], with an average temperature trend of less than 0.10°C/decade for 10 more more years [18; 242].
- Continuing-pause : There would be an ongoing pause in global warming [4; 9], with an average temperature trend of less than 0.17°C/decade [97].
- Post-2002-cooling : Climate shifted in 2001/2002 [2; 3], as per claims made by the climate scientist Anastasios Tsonis [190, page 4; 191, paragraphs 14 and 15; 192 - 194]. This shift provides a justification for inferring an ongoing post-2002 cooling trend, not just a post-1998 hiatus [3].
- IPCC-wrong : Post-1997 [677] and post-1998 temperature trends are at odds [7; 98] with a 2007 Intergovernmental Panel on Climate Change (IPCC) forecast of ~0.2°C/decade of warming for the early 21st century [45, page 1010; 159, page 7; 836, section 3.2 on page 45], particularly the first two decades of the 21st century [211; 677]. A similar point applies [18] to a 2013 IPCC forecast of 0.1 - 0.233°C/decade [45, page 1010]. So one should not expect observed warming to match the IPCC's forecasted rate [8; 98].
(A note on continuing-hiatus: Curry's 0.10°C/decade value is meant to represent the minimum trend needed for statistically significant warming [18; 242]. For longer time-periods, the uncertainty range would decrease, such that smaller rates of warming would qualify as statistically significant. For example, a trend 0.05°C/decade would qualify as statistically significant on a time-scale of 40 years, but not on a time-scale of 4 years [35, pages S17 and S18; 76; 615]. This means that as more years pass, Curry's continuing-hiatus forecast would become more likely to fail, since it would require a smaller and smaller average temperature trend. To keep things simple and to give continuing-hiatus a better chance of success, I fixed its value at 0.10°C/decade, even for longer time-periods.)
The IPCC actually projected about 0.2°C/decade of warming for the couple of decades following 2007, across a range of greenhouse gas emission scenarios [45, page 1010; 159, page 7; 160, page 763; 836, section 3.2 on page 45]. Curry therefore should have started the IPCC's trend in 2007 for IPCC-wrong, not 1998 [158, figure S1]. But looking at post-2007 temperature trends would immediately debunk Curry's IPCC-wrong forecast, since every up-to-date surface analysis shows 2007 - 2019 warming of between 0.2°C/decade - 0.4°C/decade [76; 686; 687; 698; 711 - 715, generated using 152, as per 153] (with the exception of an analysis known as CFSR [715, generated using 152, as per 153], who's flaws I discuss later in this section). So in the interest of giving Curry's IPCC-wrong forecast a better chance of succeeding, I will leave its start-point in Curry's chosen years of 1997 [18; 98; 677, with 972], 1998 [7; 13; 18; 98] or 2002 [2; 3], not in 2007.
In response, one could object that the 2007 IPCC projection should start in 2000, since the 2007 IPCC Report's model-based projection uses observed greenhouse gas levels until 1999, before shifting to projected greenhouse gas levels post-2000 [1; 160, pages 762 - 763; 836, pages 44 - 46]. Moreover, some of Curry's claims about the IPCC's projections apply to the first two decades of the 21st century [211; 677, with 972], which would mean the beginning of 2000 to the end of 2019. But starting in 2000 would result in the same problem for Curry's IPCC-wrong forecast with respect to the first two decades of the 21st century [211; 677, with 972]. After all, up-to-date surface analyses show an average warming trend in the range of 0.16°C/decade - 0.23°C/decade [76; 686; 687; 698; 716 - 720, generated using 152, as per 153] for 2000 - 2019 (with the exception of two analyses known as CFSR and MERRA-2 [721], who's flaws I discuss later in this section), thereby rounding, with one significant figure, to 0.2°C/decade. Analyses with greater global coverage show a post-2000 warming trend of 0.18°C/decade or more [76; 686; 687; 716 - 719, generated using 152, as per 153]. Since that result also undermines Curry's IPCC-wrong forecast, I will not start the trends in 2000 either, with the exception of figure 4, in the interest of again giving Curry's forecast a better chance.
Even with these concessions, a problem remains for Curry's chosen start-points: she makes sure to start her trends on, or soon before, unusually warm years such as 1998 [7; 13; 18; 98] and 2002 [2; 3]. During these years [94; 95; 332; 336 and 701, generated using 152, as per 153] the warm El Niño phase of an ocean cycle known as ENSO (the El Niño–Southern Oscillation) temporarily increases global surface temperature [94; 310; 312; 332]. Curry also makes sure to not end her trends on strong El Niño years [2; 3; 7; 13; 18; 98], instead often opting for end-points [2 - 5; 7; 10; 57; 97; 98; 314] on, or soon after [94; 95; 332; 336 and 701, generated using 152, as per 153], ENSO's colder La Niña phase that temporarily decreases global surface temperature [94; 310; 312; 332].
So what Curry does is akin to cherry-picking a start-point at midday in Canada's winter, an end-point at midnight 2 weeks later, and then using that to claim a pause/hiatus in a multi-month Canadian warming trend from winter to summer (to borrow an analogy from potholer54, a.k.a the geologist Peter Hadfield [301, from 5:22 - 11:22]). One could correct for that time-of-day cherry-picking by choosing time-points that both start at midday, just as one could (at least partially) correct for Curry's cherry-picking by selecting a start-point and end-point near similar ENSO conditions. Curry admits this [859], and she was warned of the risk of cherry-picking short time-periods when it came to human-made greenhouse-gas-induced warming [1139]. Figure 8 illustrates the perils of Curry's cherry-picking, as a greenhouse-gas-induced warming effect builds up more on multi-decadal time-scales.
Thus one should expect Curry's misleading cherry-picking of start-points and end-points to skew her temperature trends slightly below [61; 109, section 3.3; 123; 156, page 25; 157; 229, page 162] the IPCC's forecast of ~0.2°C/decade, even if the IPCC forecast matches the underlying, more representative temperature trend; I discuss this further in response to objection 2 in section 2.2. The IPCC itself noted that the 1998 strong El Niño misleadingly skewed shorter-term, post-1998 temperature trends downwards in comparison to longer-term trends [229, page 162].
Even given these points, the IPCC's forecasted post-1998 trend is somewhat similar to their post-2007 trend [1; 45, page 1010 and figure 11.25b on page 1011], and similar to their 2017 - 2040 forecasted trend that applies under conditions in which humans do not greatly limit greenhouse gas emissions [378, figure SPM.1 on page 6]. Other contrarians and myth proponents also give a ~0.2°C/decade trend [212, as per 211, 213, and 214; 215; 217, figure 3; 218, pages 14 - 15; 219; 220, section 3.4; 221; 223; 231; 246, section 3; 1100; 1101] for the IPCC's forecast, just as Curry does [7; 18; 97; 98; 211; 677]. So this blogpost will focus on that trend, while keeping in mind the 0.1 - 0.233°C/decade range Curry gave [18; 232, page 39], along with her definitions of "pause", "hiatus", and her cherry-picked start-points and end-points.
Strangely, Curry abuses the English language in order to manufacture a pause and/or hiatus in warming. She does this by claiming a "hiatus" is a temperature trend of at least 10 years long that is less than 0.10°C/decade [18; 242], a "pause" is a trend of less than 0.17°C/decade, and a "sto[p]" in warming would be a trend of less than or equal to 0.0°C/decade [97]. Thus, for instance, on these definitions continuing-hiatus entails continuing-pause, but not vice versa. Her definitions likely serve to confuse [108; 112] the audience to her "Climate Etc." blog where she makes many of her pause/hiatus claims [2 - 5; 7 - 10; 13; 14; 32; 54; 55; 57], since "pause" and "hiatus" are synonymous with "temporary stop", both in everyday life [121; 168 - 173; 307 - 309] and in much the peer-reviewed literature on temperature trends [109; 112; 120, page 226]. Elsewhere, Curry forecasts a flat temperature trend [2; 8; 13] or cooling [3; 10], with warming likely not resuming until the 2030s [4; 9; 14; 57; 1182, with 1180]. Thus her arbitrary re-definitions of the terms "pause" and "hiatus" do not change the fact that she forecasted an end to warming.
Moreover, a warming rate of less than 0.17°C/decade would hardly constitute a sensible definition of a "pause" with respect to past temperature trends on longer time-scales. Figure 1 below illustrates this point, by comparing a ~0.16°C/decade (~1.6°C per century) warming trend to other warming and cooling trends over the past 2000 years:
 |
Figure 1: Global surface temperature trend over the past 2000 years back to 1 CE, based on instrumental data (thermometers) and reconstructions from indirect, proxy measurements of temperature [24; 25]. The instrumental data extends from 1850 - 2017 [26, figure 1a]. Each trend covers a period of 51 years, stated in units of °C/century, and ends on the year given on the x-axis. The horizontal lines represent the upper range of pre-industrial (pre-1850) warming rates from reconstructions (solid green line) or calculated by climate models (dashed orange line). This figure is a simplification [24; 25] of a previously published analysis [26, figure 4a]. Multiproxy analyses confirm the instrumental warming trend [386, figure 1c; 387 - 393; 936], as do other indirect measures that do not use thermometer data for air temperatures [388, figure 3; 389, figure 4; 394; 395, generated using 152, as per 153, with the re-analyses from 394 and 396]. For further discussion of industrial-era temperature trends relative to the distant past, see sections 2.5 and 2.7 of "Myth: Attributing Warming to CO2 Involves the Fallaciously Inferring Causation from a Mere Correlation". The industrial-era warming rate is also large relative to the past ~10,000 years to ~21,000 years [741, page 2; 742, page 9; 743; 744, figures 2A and 2B, citing 745; 746; 747; 904; 933, citing 162, 743, and 745, with 934 (generated using 152, as per 153); 1126, figure 8; 1164; 1173, figure 3]. In the 12 decades from the 1900s to 2010s, Earth's surface warmed by ~1.3°C [76; 162, figure 1; 675; 679, figure 8; 683; 732; 748 - 750 and 1033, generated using 152, as per 153]; ~0.9°C of warming occurred in the 50 years from the beginning of 1970 to the end of 2019 [76; 162, figure 1; 675; 679, figure 8 [with: 1165]; 683; 732; 748 - 751 and 798, generated using 152, as per 153], coinciding with a sharp increase in the rate of human-made, greenhouse-gas-induced warming [37, as per 36; 387; 455; 456; 459; 461; 752 - 754; 755, figure 8.18 on page 699]. And ~1.0°C of global surface warming occurred from 1964 - 2019 at a rate of ~0.17°C/decade [76; 985 - 987, generated using 152, as per 153]. This places us on track for a bit less than 3°C of warming from the 1900s to end of the 21st century [500; 675; 740]. See the third panel of figure 6 for more on this. Some individuals might mistakenly believe this temperature change is irrelevant, since they experience larger local temperature fluctuations over shorter time periods. But these shorter-term local fluctuations are not comparable to the effect of longer-term global warming. As an analogy [775 - 779]: the surface of a small section of human skin could warm by 5°C for just a short time, without affecting the person's health much. But if a person had a fever where their body warmed by 2.0°C and stayed that way long-term, then that would have a larger effect on their health. Similarly, longer-term global warming can have a larger effect than shorter-term local temperature fluctuations [253; 378; 398; 742, section 17 on page 19; 757, from 30:01 to 32:32; 773; 774; 815, pages 6 - 16; 816, page 17; 817, figure 2 for v007 and figure 88 for v043; 818 - 824; 889; 937; 1025, from 20:55 to 25:15]. For instance, Earth's surface was only about 3.5°C - 5°C cooler over 17,000 years ago relative to the 1800s, during the glacial phase of Earth's ice age [251; 253; 742, page 9; 743; 757, from 30:01 to 32:32; 758, as per 759 and 760; 761 (to be read with 762 - 765); 765, with 766; 768 - 771; 772 (to be read with 837 - 839; 1004; 1005; 1065, from 14:52 to 16:30; 1068 - 1070); 933, citing 162, 743, and 745, with 934 (generated using 152, as per 153); 1025, from 20:55 to 25:15] (remembering that 1°C of warming at high latitudes translates to ~0.6°C of global warming in data for this older period [251, figure 12; 761 (to be read with 762 - 765); 1780]). Moreover, Earth's surface was only 2°C - 3°C warmer than the 2000s during the Middle Pliocene over 2.5 million years ago [766, with 767; 781, section 4.2.1 on page 2295 (along with 782, section 7 on page 1943), citing 783 and 784; 785; 786; 791; 862; 877], resulting in an ice-free Arctic Ocean in the summer [781, section 4.2.1 on page 2295 (along with 782, section 7 on page 1943), citing 783 and 784; 785; 787; 788, page S25, citing 789], along with CO2 levels of around 400ppm [766, with 767; 785; 786; 790 - 793; 862; 877; 878]. Consistent with this, scientists project an ice-free summer for the Arctic Ocean during the mid-to-late 21st century [277; 794 - 798]; CO2 levels are also now above 410ppm [799 - 805], the highest they have been in at least 2 million years [90, pages 11, 31, 53, 133, and 151; 780; 786; 790; 791; 793; 890] and increasing at a rate not seen for tens of millions of years [251; 879 - 882]. |
So if one accepts Curry's abuse of the English language, then warming of ~1.6°C/century constitutes a "pause" in warming [97], even though that warming rate is almost 3 times larger than the greatest pre-industrial warming rates over the past 2000 years. Thus Curry's ad hoc re-definition of terms such as "pause" and "hiatus" seems setup to cause her audience to under-estimate the relative magnitude of recent warming. And her continuing-pause forecast, even if successful, would therefore not, by itself, imply much about the ongoing global warming trend.
Setting aside Curry's misuse of English, how do her aforementioned listed claims hold up? 2018-not-top-five [32] is false, since 2018 was the fourth warmest year in the instrumental record at the beginning of 2019 [35, pages S5 and S11; 161; 162, section 7.1; 163; 323], as Curry herself later admitted [33]. To assess Curry's other claims, one can use temperature analyses that focus on just instrumental records from thermometers.
Though Curry often casts aspersions on some of these instrumental analyses, especially an analysis from Thomas Karl et al. at the National Oceanic and Atmospheric Administration (NOAA) and an analysis from Kevin Cowtan and Robert Way (Cowtan+Way) [16; 18; 302 - 306], she also expressed confidence in the Berkeley Earth analysis [303; 337]. Curry formerly worked with Berkeley Earth on their analysis [333; 334; 337; 567; 570; 1189] and voiced pleasure in how it turned out [337], though Berkeley Earth's fossil-fuel-industry-funded [564 - 566] results confirmed greenhouse-gas-induced [563; 567, paragraph 29 of section 5, citing 563; 568; 569] warming [162, figure 1; 378, pages 57 - 58; 380; 563; 567; 570]. Curry also conveniently overlooked Berkeley Earth's results when they got in the way of her attempts to manufacture false doubt about surface temperature trends [919 - 924]. In addition to Berkeley Earth, Curry also expressed confidence in the Hadley Climate Research Unit Temperature analysis (HadCRUT) [303]; she relies on HadCRUT4 in her published work [550, section 3.3; 551, section 3c; 552], along other instrumental analyses such as Cowtan+Way [551, section 3c; 552]. So it would still be worthwhile to examine their trends to see if they support or undermine Curry's point.
The instrumental analyses also differ in the datasets they use for sea surface temperature. There are at least three datasets: Extended Reconstructed Sea Surface Temperature (ERSST), Hadley Centre Sea Surface Temperature (HadSST), and Centennial Observation-Based Estimates of Sea Surface Temperature (COBE-SST) [433; 434; 437; 1006; 1007]. These sea surface temperature analyses are used in the following instrumental analyses [66, table 1; 608, section 2; 679 (with: 1165); 983, table 1; 1019]:
- COBE-SST : JMA
- HadSST : HadCRUT4 , Cowtan+Way , Berkeley Earth
- ERSST : NOAA , GISTEMP , CMST
CMA's CMST = China Meteorological Administration's {CMA's} China Merged Surface Temperature analysis)
Another global instrumental surface analysis known as HadOST uses air temperature data above land from Cowtan+Way, with sea surface temperature data from the Hadley Centre Sea Ice and Sea Surface Temperature analysis (HadISST2) and the Operational Sea Surface Temperature and Sea Ice Analysis (OSTIA) [36, page 4895; 37; 428; 1117, with 1118]. Figure 8 below shows results from HadOST, though monthly values from HadOST are not yet available up to 2019 [1098, from 1099]. So HadOST was not included in the figures shown in this paper.
Another global instrumental surface analysis known as HadOST uses air temperature data above land from Cowtan+Way, with sea surface temperature data from the Hadley Centre Sea Ice and Sea Surface Temperature analysis (HadISST2) and the Operational Sea Surface Temperature and Sea Ice Analysis (OSTIA) [36, page 4895; 37; 428; 1117, with 1118]. Figure 8 below shows results from HadOST, though monthly values from HadOST are not yet available up to 2019 [1098, from 1099]. So HadOST was not included in the figures shown in this paper.
The most recent versions of COBE-SST and ERSST show about the same amount of sea surface warming for the time-periods examined in this blogpost [433; 434; 1006; 1008 and 1009, generated using 152, as per 153]. However, HadSST3, the older version of HadSST, shows less warming and under-estimates recent warming [38, table 1; 50, compared to 51 and 601; 66, section 3.1; 437, with 571 and 1010], as discussed in section 2 of "Myth: Karl et al. of the NOAA Misleadingly Altered Ocean Temperature Records to Increase Global Warming". HadSST4, the update to HadSST4, corrects this issue, confirming the warming trend from the most recent versions of ERSST [437, with 571 and 1010]. Given this update, the instrumental analyses that still use HadSST3 will under-estimate recent warming; this applies to Berkeley Earth [66, section 3.1; 983, table 1; 1019 - 1021] and HadCRUT4 [66, section 3.1; 983, table 1; 1019; 1022; 1023], both of which still use HadSST3. To illustrate this point, I have included a Cowtan+Way analysis using HadSST3 and another Cowtan+Way analysis using HadSST4 ("Cowtan+Way" [61; 68; 893, from 892] and "C+W with HadSST4" [36; 571; 891, from 892], respectively). Interestingly, Curry objected to ERSSTv4 by calling HadSST3 the "gold standard dataset [303]" for recent warming, while praising the work of the HadSST team. She will presumably now need to reconcile her comments with the HadSST team validating ERSSTv4 [437, section 5.4] and admitting that HadSST3 under-estimated recent warming [437, with 571 and 1010].
And as a final note: over the oceans, observational analyses use temperature trends for the surface water [63, section 2.3.2; 158, "Methods" section; 378, page 57; 380; 599; 600; 883 (with 732)], while the IPCC's model-based projection uses temperature trends for the air above the water [45, page 955 and figure 11.25 on page 1011; 63, section 2.3.2; 158, "Methods" section; 160, pages 749, 762, and 763; 378, page 57; 380; 599; 600; 883 (with 732)]. Several papers show that performing a more accurate comparison using the same metric (surface water trends) for both the projections and observational analyses, would decrease the model-based projected warming trend by about 7% or increase the observational analyses' warming trend [63, section 2.3.2; 158, "Methods" section; 378, page 57; 380; 599; 600; 883 (with 732)], though one paper disputes this point [601; figures 12, 13, and table 1]. However, this blogpost's analysis will not include this more accurate comparison. The absence of this comparison actually benefits Curry's IPCC-wrong forecast, since it keeps the model-based warming projection larger and thus gives the IPCC's projection a better chance of over-estimating warming [63, section 2.3.2; 158, "Methods" section; 378, page 57; 380; 571; 599; 600; 883 (with 732)]. So if her forecast fails even with this factor unfairly weighted in its favor, then it truly lacks merit.
With these points in mind, figure 2 below compares global surface temperature trends from instrumental analyses, to Curry's forecasts [2 - 5; 8; 9; 13; 14; 18; 57; 97; 242] and to the IPCC's forecast [45, page 1010; 159, page 7; 836, section 3.2 on page 45] Curry objected to [7; 8; 18; 98]:
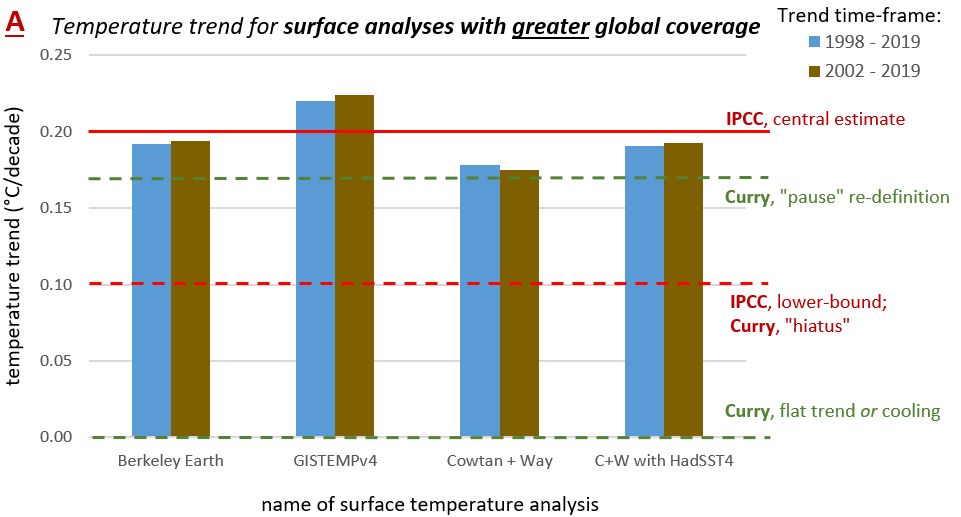
 |
Figure 2: Comparison of global surface temperature trends from instrumental analyses [76; 694 - 697, generated using 152, as per 153; 698], vs. temperature trend forecasts offered by Judith Curry and the United Nations Intergovernmental Panel on Climate Change (IPCC). The IPCC projections are ~0.2°C/decade [45, page 1010; 159, page 7; 836, section 3.2 on page 45] and 0.1 - 0.233°C/decade [45, page 1010], as per the IPCC's 2007 Fourth Assessment Report [45, page 1010; 159, page 7; 836, section 3.2 on page 45] and 2013 Fifth Assessment Report [45, page 1010], respectively. Curry objects to the accuracy of both projections [7; 8; 18; 98]. Curry's forecasts are for a "pause" [4; 9] of <0.17°C/decade [97] and a "hiatus" [5; 9; 14; 57; 1188] of <0.10°C/decade [18; 242], along with a post-1998 "flat" trend [2; 8; 13] and post-2002 cooling [2; 3] (treated here as being 0.0°C/decade and any negative temperature trend, respectively). The trend for C+W with HadSST4 goes to the end of 2018, not 2019 [76; 571; 891, from 892; 1021]; as noted earlier in this section, it is meant to act as a comparison to the Cowtan+Way analysis that uses HadSST3. The instrumental analyses are: the Berkeley Earth Surface Temperature analysis [380; 563] ; the Goddard Institute for Space Studies Surface Temperature analysis version 4 (GISTEMPv4) from NASA [162] ; HadCRUT4 from the Hadley Centre of the United Kingdom Met Office and the Climatic Research Unit of the University of East Anglia [59] ; Kevin Cowtan and Robert Way's updates of HadCRUT4 [61; 68; 893, from 892] with sea surface temperature data-sets such as Hadley Sea Surface Temperature version 4 (HadSST4) [36; 571; 891, from 892] ; the NOAA's global analysis [75; 572; 609; 887] ; and the Japan Meteorological Agency's global analysis (JMA) [59; 60]. The China Meteorological Agency (CMA) also offers global instrumental analysis with greater coverage [679; 685; 1165], but this CMST analysis currently extends to 2018, not 2019 [685 (later: 1165)]. Its 1998 - 2018 and 2002 - 2018 trends are both 0.18°C/decade [685]. Scientists will likely introduce more instrumental surface analyses in the future; this includes the upcoming GloSAT analysis, which is intended to cover global surface air trends dating back to the late 1700s [571; 913 - 917]. HadCRUT4 and Berkeley Earth both use sea surface temperature trends from the Hadley Centre Sea Surface Temperature analysis (HadSST) [608, section 2; 679; 983, table 1]. HadSST3, an older version of HadSST, under-estimates recent warming [38, table 1; 50, compared to 51 and 601; 66, section 3.1; 437, with 571 and 1010]; the update to HadSST3, HadSST4, fixes this issue [437, with 571 and 1010]. So analyses that still use HadSST3 will under-estimate recent warming. This applies to Berkeley Earth [66, section 3.1; 983, table 1; 1019 - 1021] and HadCRUT4 [66, section 3.1; 983, table 1; 1019; 1022; 1023], both of which still use HadSST3. Berkeley Earth also under-estimates Arctic warming [73; 1024]. The IPCC 2018 Special Report presents warming trends from Berkeley Earth, GISTEMP, Cowtan+Way, NOAA, HadCRUT4, and JMA [378, pages 57 - 58]. Judith Curry's published work cites trends from HadCRUT [550, section 3.3; 551, section 3c; 552], Cowtan+Way [551, section 3c; 552], GISTEMP [551, section 3c], and NOAA [551, section 3c]. Curry further reported confidence in the Berkeley Earth [303; 337] and HadCRUT analyses [303]; she formerly worked with Berkeley Earth on their analysis [333; 334; 337] and expressed pleasure in how it turned out [337]. Interestingly, Curry called HadSST3 the "gold standard dataset [303]" for recent warming, while praising the work of the HadSST team. She will presumably now need to reconcile her comments with the HadSST team admitting that HadSST3 under-estimated recent warming [437, with 571 and 1010]. |
In addition to the aforementioned instrumental analyses, one can also use a source known as the European Centre for Medium-Range Weather Forecasts' (ECMWF) Interim re-analysis (ERA-I). This re-analysis combines a diverse range of data, including surface temperature records, satellite analyses, etc. [175; 178 - 182]. I chose this re-analysis since Curry lauds re-analyses in general [16; 18 - 20; 681; 925; 927], especially [18; 20; 681; 925; 927] ERA-I, ERA-I's update ERA5 [35, pages S18 - S19; 178 - 182; 1166], and ECMWF's work [18; 20; 681; 925; 927], as shown in supplementary section 2.1. Furthermore, contrarians such as John Christy [35, pages S17 and S18; 384, pages S16 and S17; 603; 604, pages 4 - 7; 605; 606; 607, page 104], Roy Spencer [606; 610; 611; 900], Roger Pielke Sr. [603; 612; 613], Anthony Watts [619], Patrick Michaels [614; 615], Javier [620], and David Evans [621 - 623] also cite re-analyses.
But what about re-analyses other than ERA-I and ERA-5? The National Aeronautics and Space Administration's Modern-Era Retrospective Analysis for Research and Applications (NASA's MERRA-2) [49, figure 8 on page 5654; 62, sections 2.2, 7.1, and 7.3; 162; 177, figure 7a; 399, section 7 on page 5445; 651; 652; 988, using 52] and the National Centers for Environmental Prediction's Climate Forecast System Re-analysis (NCEP's CFSR) [150, figure 4a on page 2293; 175, figure 18 on page 14622] are outlier re-analyses that conflict with both surface-based analyses and satellite-based analyses. In the case of MERRA-2, the MERRA-2 team notes that MERRA-2's outlier status may result from flaws in the re-analysis [399, section 7 on page 5445; 651; 652]. It may also stem from MERRA-2 only using weather balloon data for land surface trends, instead of other data sources [62, section 7.1; 162, section 5.1.1; 400, section 2c on page 5; 401]. Evidence from satellite-based analyses suggests that an erroneous shift or discontinuity occurred in MERRA-2 in 2007/2008 [49, figure 8 on page 5654; 988, pages 5 and 14, using 52]. Consistent with this, MERRA-2 shows about as much global warming as ERA5 up until 2006, while showing less warming afterwards [989 - 991, generated using 152, as per 153]. And just as with HadCRUT4 [52; 61 - 74; 378, page 57; 380; 402], NOAA [60, page 4014; 62, sections 4 and 6; 66, section 3.1; 75, figure 1; 402], and JMA [59, section 7.4; 60, page 4014; 402, cited by 412 (with 1050, figure 1.1-2 on page 14); 608, section 2b on page 4681], MERRA-2 [62, section 7.1; 177, figure 7a; 399, section 7 on page 5445; 651; 652] under-estimates surface warming in the Arctic, which contributes to MERRA-2 under-estimating global warming.
Even the contrarian Ryan Maue [21], who Curry agrees with when it comes to re-analyses [16], recommends using ERA5 [21; 239] and the Japan Meteorological Agency's 55-year Re-analysis (JRA-55) [21; 239; 614; 615; 618] instead of MERRA-2 [21] or CFSR [21; 239]. This is because, according to Maue [239; 240, citing 407] and other sources [407; 408, page 204; 411, pages 1 and 2; 658], CFSR's data processing model changed in 2011, such that pre-2011 CFSR results were not comparable to post-2011 results. Maue speaks from experience when he discusses CFSR's problems, since he previously produced a graph of surface trends from the erroneous CFSR analysis. The Global Warming Policy Foundation (GWPF) [22; 23] then used Maue's dubious CFSR graph to claim no recent global warming occurred; this fits with GWPF's role as a politically-motivated contrarian organization [485; 638 - 643] Tsonis [635] joined and on who's behalf Curry [636; 637] (and Tsonis [190]) wrote non-peer-reviewed contrarian reports. GWPF later admitted Maue's CFSR graph was wrong [22; 23], with contrarians such as [653 - 657] Roy Spencer [611; 900], Joe Bastardi [429; 598], Anthony Watts [430; 431], and Pierre Gosselin [598] peddling the debunked graph or other similar CFSR analyses.
Thus those who rely on CFSR for surface trends do so that their own risk. Curry herself notes that CFSR conflicts with conventional analyses, including ERA-I; when discussing this, she remains inclined towards ERA-I [18]. And the scientists working on CFSR originally meant it to extend until 2009 [590; 592], supporting the idea that its trends through and past 2009 may be erroneous. Consistent with this, CFSR shows about a third more warming than ERA5 from 1990 - 2009 [409, generated using 152, as per 153] and ~17% more warming from 1998 - 2009 [593, generated using 152, as per 153], while showing substantially less warming after 2009 [410, generated using 152, as per 153]. The discontinuity in CFSR's model in 2010 or 2011 [239; 240, citing 407; 408, page 204; 411, pages 1 and 2; 658] may explain why the KNMI data repository includes CFSR results only up until about 2010, while extending other sources such as ERA-I and ERA-5 to post-2010 [238].
One can also assess CFSR and MERRA-2 via two re-analyses that do not use land-based thermometer data: the National Oceanic and Atmospheric Administration's 20th Century Re-analysis (20CR) [388; 394; 722; 1115] and the European Centre for Medium-Range Weather Forecasts' Atmospheric Reanalysis of the 20th century (ERA-20C) [388; 396; 1116]. In comparison to 20CR and ERA-20C, CFSR displays about as much [992, using 152, as per 153], or less [993, using 152, as per 153], global warming up to 2009, before CFSR's 2010/2011 shift [239; 240, citing 407; 408, page 204; 411, pages 1 and 2; 658]. And MERRA-2 shows about as much [994, using 152, as per 153], or less [995, using 152, as per 153], global warming up to 2006, before MERRA-2's 2007/2008 discontinuity [49, figure 8 on page 5654; 988, pages 5 and 14, using 52]. One can also compare these re-analyses to CERA-20C, ECMWF's Coupled Reanalysis of the 20th Century [1026 - 1028] that resulted from ERA-CLIM2 [1026; 1031; 1032, section 2.1.1 on pages 2 - 3], a process Judith Curry called true progress [20, citing 1032; 1034]. CERA-20C also shows more warming than both MERRA-2 [1029, using 152, as per 153] and CFSR [1030, using 152, as per 153], up to the 2009 period CERA-20C covers.
So MERRA-2 and CFSR likely do not significantly over-estimate global warming before their respective erroneous shifts, despite their having pre-shift warming trends on par with ERA5 [593 and 990, generated using 152, as per 153]. Resolving the MERRA-2 [49, figure 8 on page 5654; 988, pages 5 and 14, using 52] and CFSR [239; 240, citing 407; 408, page 204; 411, pages 1 and 2; 658] discontinuities would therefore likely further support ERA-5's warming trend. These discontinuities also appear in their respective comparisons to 20CR [996 and 997, using 152, as per 153], further confirming the existence of these errors in MERRA-2 [49, figure 8 on page 5654; 988, pages 5 and 14, using 52] and CFSR [239; 240, citing 407; 408, page 204; 411, pages 1 and 2; 658] (CERA-20C and ERA-20C do not extend far enough into the 2010s [238; 723 and 1033, generated using 152, as per 153] to be helpful in detecting the aforementioned discontinuities).
Finally, JRA-55 uses sea surface temperature trends from COBE-SST [62, section 2.2; 582, page 18; 583, page 150]. COBE-SST2, the update to COBE-SST, shows greater warming than COBE-SST [1006, figure 8; 1062, generated using 152, as per 153 (with 1063)], consistent with ERSSTv4 [433; 434; 1006; 1008 and 1009, generated using 152, as per 153] and other sea surface temperature analyses [38, table 1; 50, compared to 51 and 601; 66, section 3.1; 437, with 571 and 1010]. So JRA-55 likely under-estimates global warming in virtue of using COBE-SST. The Japanese Reanalysis for Three Quarters of a Century (JRA-3Q), the planned update to JRA-55, will address this issue by using [1060; 1061] COBE-SST2 and MGDSST (Merged satellite and in situ data Global Daily Sea Surface Temperature [1141; 1142]) for sea surface temperature trends. ERA-I also under-estimates recent warming due to issues in its SST analysis, as admitted by the ERA-I team [62, section 2.2] and Judith Curry [552, page 401].
Taken together, these points imply that the CFSR, MERRA-2, JMA, HadCRUT4, JRA-55, NOAA, and ERA-I trends (in order from lowest reliability to highest reliability for recent surface trends) should carry less weight than the other analyses. Figure 3 below compares re-analyses' global surface temperature trends, to Curry's forecasts [2 - 5; 8; 9; 13; 14; 18; 57; 97; 242] and to the IPCC's forecast [45, page 1010; 159, page 7; 836, section 3.2 on page 45] Curry objected to [7; 8; 18; 98]:

 |
Figure 3: Comparison of global surface temperature trends from re-analyses [686; 687; 688 - 693, generated using 152, as per 153], vs. temperature trend forecasts offered by Judith Curry and the United Nations Intergovernmental Panel on Climate Change (IPCC). The IPCC projections are ~0.2°C/decade [45, page 1010; 159, page 7; 836, section 3.2 on page 45] and 0.1 - 0.233°C/decade [45, page 1010], as per the IPCC's 2007 Fourth Assessment Report [45, page 1010; 159, page 7; 836, section 3.2 on page 45] and 2013 Fifth Assessment Report [45, page 1010], respectively. Curry objects to the accuracy of both projections [7; 8; 18; 98]. Curry's forecasts are for a "pause" [4; 9] of <0.17°C/decade [97] and a "hiatus" [5; 9; 14; 57; 1188] of <0.10°C/decade [18; 242], along with a post-1998 "flat" trend [2; 8; 13] and post-2002 cooling [2; 3] (treated here as being 0.0°C/decade and any negative temperature trend, respectively). Post-1997 trends tell a similar story [76; 686; 687; 698; 869 - 873, generated using 152, as per 153], with a trend of 0.17°C/decade or more, rounded to two significant figures, for non-outlier re-analyses [686; 687; 871 and 872, generated using 152, as per 153]. The re-analyses are: the European Centre for Medium-Range Weather Forecasts' Re-analysis 5 (ERA5) [35, pages S18 - S19; 178 - 182; 1166], which serves as the recent update to the European Centre for Medium-Range Weather Forecasts' (ECWMF's) Interim re-analysis (ERA-I) [35, pages S18 - S19; 178 - 182; 1166] ; the Japan Meteorological Agency's 55-year Re-analysis (JRA-55) [581 - 584] ; the National Centers for Environmental Prediction's Reanalysis-2 (NCEP-2) [585; 586] ; NASA's Modern-Era Retrospective Analysis for Research and Applications (MERRA-2) [587; 588] ; and the National Centers for Environmental Prediction's Climate Forecast System Re-analysis (CFSR) [589 - 592]. The NOAA's 20th Century Re-analysis (20CR) [388; 394; 722; 1115], along with the European Centre for Medium-Range Weather Forecasts' Atmospheric Reanalysis of the 20th century [388; 396; 1116] and their Coupled Reanalysis of the 20th Century [1026 - 1028] (ERA-20C and CERA-20C, respectively) do not currently reach up to 2016 [238; 723 and 1033, generated using 152, as per 153], and thus were not included in this figure. The IPCC 2018 Special Report presents warming trends from ERA-I and JRA-55 [378, pages 57 - 58]. Curry recommends using re-analyses in general [16; 18 - 20; 681; 925; 927], while lauding ERA-I, ERA5, and ECMWF's work [18; 20; 681; 925; 927]. Finally, JRA-55 uses sea surface temperature trends from COBE-SST [62, section 2.2; 582, page 18; 583, page 150]. COBE-SST2, the update to COBE-SST, shows greater warming than COBE-SST [1006, figure 8; 1062, generated using 152, as per 153 (with 1063)], consistent with ERSSTv4 [433; 434; 1006; 1008 and 1009, generated using 152, as per 153] and other sea surface temperature analyses [38, table 1; 50, compared to 51 and 601; 66, section 3.1; 437, with 571 and 1010]. So JRA-55 likely under-estimates global warming in virtue of using COBE-SST. The Japanese Reanalysis for Three Quarters of a Century (JRA-3Q), the planned update to JRA-55, will address this issue by using COBE-SST2 and MGDSST for sea surface temperature trends [1060; 1061]. ERA5 shows more warming than ERA-I, likely due to flaws in ERA-I's sea surface temperature analysis, as admitted by the ERA-I team [62, section 2.2] and Judith Curry [552, page 401]. The outlier status of MERRA-2 [49, figure 8 on page 5654; 62, sections 2.2, 7.1, and 7.3; 162; 177, figure 7a; 399, section 7 on page 5445; 651; 652; 988, using 52] and CFSR [150, figure 4a on page 2293; 175, figure 18 on page 14622] stem largely from MERRA-2 under-estimating warming [62, section 7.1; 177, figure 7a; 399, section 7 on page 5445; 651; 652] in the rapidly warming Arctic [52; 65; 177; 390; 403, figure 2; 404 - 406; 1024; 1085; 1086], and CFSR shifting the model it uses to assimilate data in 2010 or 2011 [239; 240, citing 407; 408, page 204; 411, pages 1 and 2; 658]; the scientists working on CFSR originally meant it to extend until 2009 [590; 592]. Consistent with this, CFSR shows ~17% more warming than ERA5 from 1998 - 2009 [593, generated using 152, as per 153], while showing substantially less warming afterwards [594, generated using 152, as per 153]. Similarly, evidence from satellite-based analyses suggests that an erroneous shift or discontinuity occurred in MERRA-2 in 2007/2008 [49, figure 8 on page 5654; 988, pages 5 and 14, using 52]. Consistent with this, MERRA-2 shows about as much global warming as ERA5 up until 2006, while showing less warming afterwards [989 - 991, generated using 152, as per 153]. So resolving MERRA-2's and CFSR's shifts would likely further support the IPCC's projected trend and undermine Curry's forecast. In comparison to the 20CR [388; 394; 722; 1115] and ERA-20C [388; 396; 1116] re-analyses that do not use land-based thermometer data, MERRA-2 displays about as much [994, using 152, as per 153], or less [995, using 152, as per 153], global warming up to 2006; CFSR displays about as much [992, using 152, as per 153], or less [993, using 152, as per 153], global warming up to 2009. This further supports the idea neither MERRA-2 nor CFSR significantly over-estimate global warming before their respective erroneous shifts, despite their having pre-shift warming trends on par with ERA5 [593 and 990, generated using 152, as per 153]. The 2007/2008 MERRA-2 [49, figure 8 on page 5654; 988, pages 5 and 14, using 52] and 2010/2011 CFSR [239; 240, citing 407; 408, page 204; 411, pages 1 and 2; 658] discontinuities also appear in their respective comparisons to 20CR [996 and 997, using 152, as per 153], further confirming the existence of these discontinuities (ERA-20C and CERA-20C [238; 723 and 1033, generated using 152, as per 153] do not extend far enough into the 2010s to be helpful in detecting the aforementioned discontinuities). |
One might complain that the temperature trends from figures 2 and 3 lack error bars. But that objection does not help Curry's case, since she focuses on the average trend when determining whether a pause/hiatus occurred [18; 97], as figures 2 and 3 do. Moreover, appealing to error bars would undermine Curry's position, since, for instance, most of the error bars would comfortably overlap with the IPCC's forecast of ~0.2°C/decade, undermining her IPCC-wrong forecast. Conversely, note that the error bars would not save Curry's continuing-hiatus and continuing-pause predictions, since those predictions required that the average temperature trend be less than 0.10°C/decade [18; 242] and 0.17°C/decade [97], respectively, not that the errors bars failed to overlap with trends of 0.10°C/decade and 0.17°C/decade.
Take, for example, the 1997 - 2019 warming trends shown below, with +/- 2σ statistical uncertainty (in °C/decade; the trend for "C+W with HadSST4" ends in 2018, not 2019 [76; 571; 891, from 892; 1021]):
- Berkeley Earth [380; 563] : 0.19 +/- 0.08 [76; 573; 894]
- GISTEMPv4 [162] : 0.21 +/- 0.09 [76; 322; 574]
- Cowtan+Way [61; 68; 893, from 892] : 0.18 +/- 0.08 [76; 575; 893, from 892; 895]
- C+W with HadSST4 [36; 571; 891, from 892] : 0.19 +/- 0.09 [76; 575; 576; 891, from 892]
- NOAA [75; 572; 609; 887] : 0.18 +/- 0.10 [76; 577; 578]
- HadCRUT4 [59] : 0.14 +/- 0.08 [76; 579; 580]
Corresponding 1998 - 2019 warming trends are shown below, with +/- 2σ statistical uncertainty (in °C/decade; the trend for "C+W with HadSST4" ends in 2018, not 2019 [76; 571; 891, from 892; 1021]):
- Berkeley Earth [380; 563] : 0.19 +/- 0.08 [76; 573; 894]
- GISTEMPv4 [162] : 0.22 +/- 0.10 [76; 322; 574]
- Cowtan+Way [61; 68; 893, from 892] : 0.18 +/- 0.09 [76; 575; 893, from 892; 895]
- C+W with HadSST4 [36; 571; 891, from 892] : 0.19 +/- 0.09 [76; 575; 576; 891, from 892]
- NOAA [75; 572; 609; 887] : 0.19 +/- 0.10 [76; 577; 578]
- HadCRUT4 [59] : 0.14 +/- 0.09 [76; 579; 580]
Below are 2000 - 2019 warming trends, with +/- 2σ statistical uncertainty (in °C/decade; the trend for "C+W with HadSST4" ends in 2018, not 2019 [76; 571; 891, from 892; 1021]):
- Berkeley Earth [380; 563] : 0.21 +/- 0.09 [76; 573; 894]
- GISTEMPv4 [162] : 0.23 +/- 0.11 [76; 322; 574]
- Cowtan+Way [61; 68; 893, from 892] : 0.19 +/- 0.10 [76; 575; 893, from 892; 895]
- C+W with HadSST4 [36; 571; 891, from 892] : 0.21 +/- 0.10 [76; 575; 576; 891, from 892]
- NOAA [75; 572; 609; 887] : 0.21 +/- 0.12 [76; 577; 578]
- HadCRUT4 [59] : 0.16 +/- 0.10 [76; 579; 580]
And below are corresponding 2002 - 2019 warming trends, with +/- 2σ statistical uncertainty (in °C/decade; the trend for "C+W with HadSST4" ends in 2018, not 2019 [76; 571; 891, from 892; 1021])
- Berkeley Earth [380; 563] : 0.19 +/- 0.11 [76; 573; 894]
- GISTEMPv4 [162] : 0.22 +/- 0.13 [76; 322; 574]
- Cowtan+Way [61; 68; 893, from 892] : 0.18 +/- 0.12 [76; 575; 893, from 892; 895]
- C+W with HadSST4 [36; 571; 891, from 892] : 0.19 +/- 0.12 [76; 575; 576; 891, from 892]
- NOAA [75; 572] : 0.20 +/- 0.14 [76; 577; 578]
- HadCRUT4 [59] : 0.15 +/- 0.11 [76; 579; 580]
(The uncertainty estimates decrease once one takes a pooled average of the analyses [35, pages S17 and S18; 384, page S16]. The statistical uncertainty is smaller for the 1997 - 2019 trends than for the 2002 - 2019 trends, as one would expect with a larger sample size [76; 152, as per 153]. So as time progresses beyond 2019, the statistical uncertainty for the post-1998 and post-2002 trends should decrease further.)
Alternatively, one might be tempted to note that, for example, CFSR, MERRA-2, JMA, and HadCRUT4 substantially differ from the IPCC's trend of ~0.2°C/decade [45, page 1010; 159, page 7; 160, page 76; 836, section 3.2 on page 45]. But cherry-picking these analyses would run fall afoul of the aforementioned notes, such as CFSR's model shift in 2011 [239; 240, citing 407; 408, page 204; 411, pages 1 and 2; 658], the poorer global coverage of JMA [59, section 7.4; 60, page 4014; 402, cited by 412 (with 1050, figure 1.1-2 on page 14); 608, section 2b on page 4681] and HadCRUT4 [52; 61; 62, section 4; 63, figure 1, sections 4.2.2 and 4.2.3; 64 - 74; 378, page 57; 380], and Maue's advice to opt for ERA5 [21; 239] and JRA-55 [21; 239; 614; 615; 618] over MERRA-2 [21] and CFSR [21; 239] (remembering that Curry agrees with Maue on re-analyses [16]). When one moves beyond this cherry-picking of a minority of the analyses, the majority of analyses, particularly those with greater coverage, contradict Curry's forecasts of post-1998-flat [2; 8; 13], continuing-hiatus [5; 9; 14; 57; 1188], continuing-pause [4; 9], post-2002-cooling [2; 3], and IPCC-wrong [8; 98], as per figures 2 and 3.
One should also remember that Curry approved of at least 4 analyses: Berkeley Earth [303; 337], HadCRUT4 [303], and ECMWF's work in ERA-I and ERA5 [18; 20; 681; 925; 927]. As Curry stated in February 2020:
"For trends in global temperature, I much prefer reanalyses such as ERA5, with the obvious caveat that this record only goes back to 1980 (soon to go back to 1950) [925]."
None of the aforementioned 4 analyses support post-1998-flat [2; 8; 13], continuing-hiatus [5; 9; 14; 57; 1188], and post-2002 cooling [2; 3], as per figures 2 and 3. And only HadCRUT4, with its poorer global coverage [52; 61; 62, section 4; 63, figure 1, sections 4.2.2 and 4.2.3; 64 - 74; 378, page 57; 380], supports continuing-pause [4; 9]. Figure 4 below illustrates this point by focusing on the analyses Curry approved of:
 |
Figure 4: Comparison of global surface temperature trends from observational analyses [76; 686; 687; 692 - 695, 717, 718, 720, and 869 - 871, generated using 152, as per 153], vs. temperature trend forecasts offered by Judith Curry and the United Nations Intergovernmental Panel on Climate Change (IPCC). The IPCC projection is 0.1 - 0.233°C/decade [45, page 1010] from the IPCC's 2013 Fifth Assessment Report [45, page 1010], who's range includes a ~0.2°C/decade post-2007 projection from the IPCC's 2007 Fourth Assessment Report [45, page 1010; 159, page 7; 836, section 3.2 on page 45]. Curry objects to the accuracy of both projections [7; 8; 18; 98]. She notes the 2007 IPCC projection covers the first two decades of the 21st century [211; 677, with 972]; this 2007 model-based projection uses observed greenhouse gas levels until 1999, before shifting to projected greenhouse gas levels post-2000 [1; 160, pages 762 - 763; 836, pages 44 - 46]. Hence the inclusion of the 2000 - 2019 time-period, covering the first two decades of the 21st century. Curry also discusses post-1997 trends [18; 98; 677, with 972], using them to object to the IPCC's 2007 projection [677, with 972]. Curry's depicted forecast is for a "hiatus" [5; 9; 14; 57; 1188] of <0.10°C/decade [18; 242], who's range includes her forecasts of a post-1998 "flat" trend [2; 8; 13] and post-2002 cooling [2; 3] (treated here as being 0.0°C/decade and any negative temperature trend, respectively). Error bars are not included for the comparisons to Curry's forecasts, since she focuses on the average temperature trend [18; 97], not what is encompassed by the uncertainty range. For examples of error bars for the Berkeley Earth and HadCRUT4 analyses [76], see earlier in this section. This figure depicts results from two re-analyses and two instrumental analyses. The re-analyses are the European Centre for Medium-Range Weather Forecasts' Re-analysis 5 (ERA5) [35, pages S18 - S19; 178 - 182; 1166], which serves as the recent update to the European Centre for Medium-Range Weather Forecasts' (ECWMF's) Interim re-analysis (ERA-I) [35, pages S18 - S19; 178 - 182; 1166]. The instrumental analyses are the Berkeley Earth Surface Temperature analysis [380; 563], and HadCRUT4 from the Hadley Centre of the United Kingdom Met Office and the Climatic Research Unit of the University of East Anglia [59]. HadCRUT4 under-estimates recent warming due to its poorer coverage of the globe [52; 61; 62, section 4; 63, figure 1, sections 4.2.2 and 4.2.3; 64 - 74; 378, page 57; 380; 402, cited by 412; 608, section 2b on page 4681], as admitted by members of the Hadley Centre team [70]; in particular, HadCRUT4 under-estimates warming in the Arctic [52; 61 - 74; 378, page 57; 380; 402], one of the most rapidly warming regions on Earth [52; 65; 177; 390; 403, figure 2; 404 - 406; 1024; 1085; 1086]. This contributes to HadCRUT4 showing less warming than the other analyses depicted in this figure. Berkeley Earth also under-estimates Arctic warming [73; 1024], but to a lesser extent. HadCRUT4 and Berkeley Earth both use sea surface temperature trends from the Hadley Centre Sea Surface Temperature analysis (HadSST) [608, section 2; 679; 983, table 1]. HadSST3, an older version of HadSST, under-estimates recent warming [38, table 1; 50, compared to 51 and 601; 66, section 3.1; 437, with 571 and 1010]; the update to HadSST3, HadSST4, fixes this issue [437, with 571 and 1010]. So analyses that still use HadSST3 will under-estimate recent warming. This applies to Berkeley Earth [66, section 3.1; 983, table 1; 1019 - 1021] and HadCRUT4 [66, section 3.1; 983, table 1; 1019; 1022; 1023], both of which still use HadSST3. And ERA5 shows more warming than ERA-I, likely due to flaws in ERA-I's sea surface temperature analysis, as admitted by the ERA-I team [62, section 2.2] and Judith Curry [552, page 401]. The IPCC 2018 Special Report presents warming trends from ERA-I, Berkeley Earth, and HadCRUT4 [378, pages 57 - 58]. Curry recommends using re-analyses in general [16; 18 - 20; 681; 925; 927], while lauding ERA-I, ERA5, and ECMWF's work [18; 20; 681; 925; 927]. Curry further reported confidence in the Berkeley Earth [303; 337] and HadCRUT analyses [303]; she formerly worked with Berkeley Earth on their analysis [333; 334; 337] and expressed pleasure in how it turned out [337]. And in her published work she cites trends from HadCRUT4 [550, section 3.3; 551, section 3c; 552]. Interestingly, Curry called HadSST3 the "gold standard dataset [303]" for recent warming, while praising the work of the HadSST team. She will presumably now need to reconcile her comments with the HadSST team admitting that HadSST3 under-estimated recent warming [437, with 571 and 1010]. |
So overall, most of the analyses, even those Curry approves of, conflict with Curry's forecasts, while remaining consistent with the IPCC's forecast, as per figures 2, 3, and 4. This holds despite at least two factors that would serve to misleadingly and illegitimately exaggerate differences between the observational analyses vs. the IPCC's model-based forecast. Namely: 1) Curry's cherry-picking [61; 109, section 3.3; 123; 156, page 25; 157; 229, page 162] of start-points {1997, 1998, and 2002} [2; 3; 7; 13; 18; 98] skewed [94; 95; 332; 336 and 701, generated using 152, as per 153] by a warm El Niño and end-points [2 - 5; 7; 10; 57; 97; 98; 314] skewed [94; 95; 332; 336 and 701, generated using 152, as per 153] by a cold La Niña, and 2) models [63, section 2.3.2; 158, "Methods" section; 378, page 57; 380; 599; 600; 883 (with 732)] using air temperature trends above oceans [45, page 955 and figure 11.25 on page 1011; 63, section 2.3.2; 158, "Methods" section; 160, pages 749, 762, and 763; 378, page 57; 380; 599; 600; 883 (with 732)], while the observational analyses used ocean surface water trends [63, section 2.3.2; 158, "Methods" section; 378, page 57; 380; 599; 600; 883 (with 732)]; both of these factors were discussed earlier in this section.
Other sources similarly note that recent surface warming trends remain consistent with model-based predictions [1, as per 158, figure S1; 63; 64; 167; 310; 311, figure 7; 312; 883 (with 732)]. I discuss this issue further in section 2.2 of "Myth: Santer et al. Show that Climate Models are Very Flawed" and in section 2.4 of "Myth: Attributing Warming to CO2 Involves the Fallaciously Inferring Causation from a Mere Correlation", especially with respect to 1988 predictions [875] (later borne out by evidence) from the heavily-cited [852; 853] climate scientist Veerabhadran Ramanathan. In 2018, Ramanathan confirmed an ongoing ~0.2°C/decade warming trend, while projecting a further acceleration of this warming trend [851], consistent with other sources [999 (with: 1000 - 1003; 1130; 1131; 1153, supplemental figure S6e)] on already accelerating climate change [445; 559; 671; 841; 842; 843, confirmed using 76, along with 849 and 850 (generated using 152, as per 153); 845 - 848; 938; 939, confirmed using 76, along with 940 and 941 (generated using 152, as per 153); 984 (with 1058, 1059, and 1064); 1071 - 1076 and 1109 - 1111, generated using 152, as per 153; 1097; 1120 - 1122]. Then in 2019, Berkeley Earth also noted a post-1980 warming trend of 0.19°C/decade, while stating that trend changed little during the post-1980 period [675; supported by 76 and 826 (generated using 152, as per 153)]; their lack of significant warming acceleration likely results from them under-estimating recent warming due to their use [66, section 3.1; 983, table 1; 1019 - 1021] of the HadSST3 analysis [38, table 1; 50, compared to 51 and 601; 66, section 3.1; 437, with 571 and 1010], as discussed earlier in this section (see the third panel of figure 6 below). In contrast, Curry's preferred [681; 925; 927] ERA5 re-analysis shows accelerating global warming [559 and 671, confirmed using 1071 - 1073 (generated using 152, as per 153); 984 (with 1058, 1059, and 1064)], as do GISTEMP [671, confirmed using 1071 - 1073 (generated using 152, as per 153); 843, confirmed using 76, along with 849 and 850 (generated using 152, as per 153); 939, confirmed using 76, along with 940 and 941 (generated using 152, as per 153); 984 (with 1058, 1059, and 1064)], NOAA [671, confirmed using 76, along with 1074 - 1076 (generated using 152, as per 153); 984 (with 1058, 1059, and 1064)], NCEP-2 [984 (with 1058, 1059, and 1064); 1074 - 1076, generated using 152, as per 153], 20CR [1109 - 1111, generated using 152, as per 153], and HadOST, as per figure 8. And the IPCC's 2018 Special Report showed that human-made global warming continued at a rate of ~0.2°C/decade, in accordance with climate models [378, pages 4 and 57 - 59]. Thus Curry's claims failed in comparison to those from the IPCC.
That conclusion shines a particularly negative light on Curry's history of outlandish claims about the UN's IPCC and the scientists who contribute to it [10 - 12; 96; 345; 372; 756; 932; 1056, with 1057]. For instance, Curry promoted debunked smears of NOAA scientists who presented evidence undermining her claim of a pauses, as shown in "Myth: Karl et al. of the NOAA Misleadingly Altered Ocean Temperature Records to Increase Global Warming". And she launched unsupported, ridiculous charges against the scientific community, such as:
"[...] as temperatures have declined and climate models have failed to predict this decline, the IPCC has gained confidence in catastrophic warming and dismisses the pause as unpredictable climate variability [...].
We need to put down the IPCC as soon as possible – not to protect the patient who seems to be thriving in its own little cocoon, but for the sake of the rest of us whom it is trying to infect with its disease [10]."
"Well thank you IPCC authors [includes: Kevin Trenberth, Susan Solomon, Ben Santer, and Judith Lean] for letting us know what is really behind that “very likely” assessment of attribution 20th century warming [sic]. A lot of overbloated over confidence that cannot survive a few years of cooling. The light bulbs seem to be just turning on in your heads over the last two years [932]."
"When I refer to the IPCC dogma, it is the religious importance that the IPCC holds for this cadre of scientists; they will tolerate no dissent, and seek to trample and discredit anyone who challenges the IPCC. Who are these priests of the IPCC? [...] These scientists have used to IPCC to gain a seat at the “big tables” where they can play power politics with the collective expertise of the IPCC, to obtain personal publicity, and to advance their careers [12]."
"Climatology has become a political party with totalitarian tendencies [...]. If you don’t support the UN consensus on human-caused global warming, if you express the slightest skepticism, you are a ‘climate-change denier,’ a stooge of Donald Trump, a quasi-fascist who must be banned from the scientific community [1056, with 1057]."
To borrow her terminology: Curry resorts to toxic rhetoric on climate change [998]. Curry's defenders should heed her advice to "read what [she] write[s] [806]," so they understand why scientists debunk [183; 187; 242; 360; 372; 487 - 494; 553 - 555; 953 - 955; 961; 975; 976; 1044, page 1148; 1046 - 1049; 1053, citing 1054 and 1055; 1094; 1095; 1129] (or ignore) Curry in the way they do; see section 2 of "Myth: Judith Curry Fully and Accurately Represents Scientific Research" for more on this.
As we move into the third decade of the 21st century, one might hope that people would stop peddling Curry's nonsense. But I doubt reality will fulfill that hope. In my experience [368 and 1149, with subsequent tweets listed as replies to them], many of the people who approvingly cite Curry in online discussions do not honestly care if evidence supports her claims. Instead they cite Curry for some of the same reasons other science denialists, such as HIV/AIDS denialists and the tobacco industry's defenders, cite contrarian scientists. These reasons include [346 - 356; 362 - 365; 366, from 1:39:29 to 1:40:21; 367; 706; 899; 1152; 1174, page 7]:
I expect that such reasons will motivate many people to continue spreading Curry's debunked claims and to continue investing undue trust in her, just as those reasons continue to motivate other science denialists [346 - 356; 362 - 365; 366, from 1:39:29 to 1:40:21; 367; 706; 899; 1152; 1174, page 7] to rely on contrarian/denialist sources. I elaborate on these motivations in response to objection 9 in section 2.2. And just as those reasons drive many of Curry's defenders [369 - 371; 373 - 375; 376; 885, with 886 and 946 - 949], those same reasons propel Curry as well, as per the above quotes [10 - 12; 932; 1056, with 1057] from her.
So I also do not expect Curry to admit she was wrong on her temperature trend claims, despite the fact that she is well-aware that post-1998 and post-2002 warming occurred [232, page 40; 249; 316; 1180]. After all, a continuing, significant pause/hiatus remains central to her position, as I discuss in response to objections 7, 8, and 9 in section 2.2. Therefore, admitting no such pause/hiatus exists, and that her IPCC-wrong forecast failed, greatly undermines her position. In fact, Curry offered the following false claim on October 16, 2019, without bothering to provide any evidence for her claim:
"Early predictions of warming were 0.2 to 0.3 degrees Centigrade per decade are too high relative actual observation. [...] Define ‘early’. My definition of ‘early’ does not include 2018. Try FAR, SAR, TAR, AR4 [the IPCC's First, Second, Third, and Fourth Assessment Reports, respectively] [383]"
In December 2019 she also doubled-down on her continuous-hiatus forecast [5; 9; 14; 57; 1188] of less than 0.10°C/decade of warming [18; 242], by predicting ~1.0°C of "business as usual" warming for the 21st century until 2100 [497]. Curry attempts to justify this forecast by using [497] a blogpost from her colleague Nic Lewis [625] to cherry-pick a low, outlier value for shorter-term climate sensitivity (e.g. a low value for how much the climate warms in response to changes in greenhouse gases such as carbon dioxide). I critique Lewis+Curry's low estimate in sections 2.5 and 2.7 of "Myth: Attributing Warming to CO2 Involves the Fallaciously Inferring Causation from a Mere Correlation"; other sources reach support a higher value for shorter-term climate sensitivity [36; 158; 626, figure 1; 627 - 634], further undermining Curry's borderline hiatus forecast of ~1°C of 21st century warming [497].
In 1993, the contrarian Matt Ridley also attempted to justify a prediction of ~1°C/century of warming [644 - 648; 699; 700; 702; 1113; 1114], while later casting doubt on the IPCC's model-based projections [649; 650; 699]. To make his claim, Ridley uses both surface analyses and satellite-based bulk atmospheric analyses [644], the latter of which I address in response to objection 3 in section 2.2. The average of the two satellite-based analyses, both of which under-estimate recent warming [35, page S17; 46, figure 10; 47, page 7715; 48] (as admitted by one of the satellite-based research teams [35, page S17; 47, page 7715; 48]), shows ~1.8 times more warming than Ridley predicted [644 - 648; 699; 700; 702; 1113; 1114]. With respect to the surface analyses, the analyses with greater global coverage show about double the rate of warming [76; 685 - 687; 724 - 727, generated using 152, as per 153] Ridley forecasted [644 - 648; 699; 700; 702; 1113; 1114], and the analyses with less global coverage show ~1.7 times more warming [76; 698; 728, generated using 152, as per 153]. MERRA-2 and CFSR [729, generated using 152, as per 153] are two outliers on this that under-estimate warming for the reasons noted earlier in this section, though even MERRA-2 shows ~1.6 times as much post-1993 warming [729, generated using 152, as per 153] as Ridley predicted [644 - 648; 699; 700; 702; 1113; 1114].
In addition to Ridley, the contrarians Ryan Maue and Patrick Michaels misleadingly defend [614] Curry's ~1°C/century forecast [497]. To do this, they remove recent warming from the JRA-55 analysis to make it appear as if JRA-55 shows post-1979 warming trend of 0.10°C/decade [614; 615]. Yet JRA-55 actually shows a trend of 0.17 +/- 0.03°C/decade [615; 624, generated using 152, as per 153]. So Maue and Michaels' own source further undercuts [615; 624, generated using 152, as per 153] the ~1°C projection they [614] and Curry [497] defend.
(Funnily enough, Ridley [1011; 1018], Curry [372 (cited by 501 and 502); 602; 616; 617], and Maue's co-author [614] Michaels [1012, from 14:19 to 16:11; 1013; 1014] either directly profit from the fossil fuel industry or receive funding from the fossil fuel / energy industries. Michaels and Maue also made their temperature trend claims in a document [614] for the Cato Institute, a fossil-fuel-industry-funded [1015 - 1017] organization. Of course, it may just be a coincidence that fossil-fuel-funding surrounds these four individuals who inaccurately downplayed human-made greenhouse-gas-induced warming.)
The dubious projections of Michaels, Maue [614], Curry [497], and Ridley [644 - 648; 699; 700; 702] contrast with more mainstream estimates of another ~2°C of "business as usual" warming during the 21st century [500; 675; 740; 926]. This ~2°C projection makes sense in light of the accelerated post-1960s warming in figure 1 above, the more global (non-outlier) post-1998 and post-2002 warming trends in figures 2, 3, and 4 above, the ~0.2°C/decade post-1970s warming trend in figure 6 below, and the ~0.2°C/decade post-1990 warming trend shown in figure 4 of section 2.1 of "Myth: The IPCC's 1990 Report Over-estimated Greenhouse-gas-induced Global Warming". Moreover, as previously mentioned, Berkeley Earth stated warming continued at 0.19°C/decade [675; supported by 76 and 826 (generated using 152, as per 153)], while the IPCC's 2018 Special Report similarly noted that human-made global warming continues at a rate of 0.2°C/decade. And unlike Curry, the IPCC actually cited evidence backing up its statement on what the current global warming trend is [378, pages 4 and 57 - 59].
So despite the scientific evidence rebutting Curry's forecasts, Curry just extends her claims further into the future through the 21st century [13; 14; 247; 414; 497; 861; 863; 1175; 1176] to mislead more people and unjustifiably downplay human-induced climate change [5; 7; 14; 57; 98; 497; 498 (with 383); 499; 1154 (with: 1155; 1156); 1157; 1160 (with 1161)]. Thus the failure of temperature trend forecasts from contrarians such as Curry, Michaels, Maue, and Ridley, gives one every reason to doubt their predictions for the future; similarly, the accuracy of the IPCC's temperature trend forecasts should increase one's confidence in the IPCC's future predictions.
Interestingly, beginning in 2017, Curry, as far I can tell, stopped publicly evaluating up-to-date temperatures analyses to see if her supposed pause/hiatus still existed [731 (from 233, compare: 607, 664 - 666; to: 176; 313; 314; 663)]. This contrasts with her behavior from 2011 - 2015, when she frequently discussed the pause/hiatus and presented temperature trends [2 - 5; 7 - 9; 10; 18; 19; 57; 97; 98; 313; 314], as per supplementary section 2.2. Post-2015, Curry says one should wait for several years before seeing if the pause continued [13], simply assumes (without presenting evidence) that the hiatus continued, that it may go on for decades [14; 247], that one should expect another hiatus [414], and that one should expect very limited 21st century human-made global warming [497]. She thus moves the goalposts to avoid falsification of her predictions, as per my response to objection 4 in section 2.2.
The ERA-I / ERA5 research team [1044, page 1148, citing 1045], and the climate scientist Robert Way [490; 1046, with 1047; 1048; 1049], also note that Curry mentions [1045] re-analyses without substantively commenting on the meaning of their trends, when those trends support larger estimates of warming. Curry even went so far as to repeatedly block comments that showed recent warming rebutted her claims on a hiatus [415; 416]. When she later allowed other criticisms through, her response did nothing to show her forecasts were accurate [383; 859; 860; 863]. And Curry went back to knowingly concealing evidence that rebutted her forecasts, even though the evidence met the specifications she requested [951, with 950 and 960]; I discuss this further in response to objection 5 in section 2.2.
To further illustrate Curry's evasiveness, first note that as of January 16, 2020, Curry wrote on her website that her "views on climate change are best summarized by [her] recent Congressional Testimony [233]." So one could plausibly construe this testimony as representing the evolution of her stated position. On her website she then lists nine examples of her testimony, spanning the decade from 2010 - 2019 [233]. They are, in chronological order:
To make matters worse: in January and February 2020, after being shown evidence of post-1998 and post-2002 global warming, she expressed surprise that anyone would claim she said global warming "stopped" in 1998 [668; 703; 705]. Yet it took very little time for people to find out [669; 704] she actually said it [7; 670; 680; 1112]. So Curry continues to retreat from her previous claims, without admitting she was wrong. She even tries to cite the IPCC to defend her hiatus claims [668; 705]; I debunk this ludicrous defense in response to objection 6 in section 2.2. The supposed pause/hiatus thus went from being, in Curry's words from 2012 and 2013, "the heart of the recent scientific debate on climate change [1148]," and "the most important issue in the public debate on climate science, for well over a year now [678]," to now being something she scarcely mentions. To appropriate a phrase Curry applied to the IPCC [678]: one might wonder how Judith Curry forgot to mention the pause.
So what could explain Curry's above post-2015 / post-2016 shift, where she sharply curtails her discussion of a supposed pause/hiatus [731 (from 233, compare: 607, 664 - 666; to: 176; 313; 314; 663)]? Well, one might suspect Curry is running from addressing the post-2015 warmer period shown in figures 6, 8, 9, and 10, lest she have to admit she was wrong in her temperature trend forecasts:


Figure 6 also stands in stark contrast to Anastasios Tsonis' claim that climate shifted [190, page 4; 191, paragraphs 14 and 15; 192 - 194; 426; 427] such that the warming of the 1980s and 1990s would not continue. As Tsonis is quoted as saying in 2013:
"We are already in a cooling trend, which I think will continue for the next 15 years at least. There is no doubt the warming of the 1980s and 1990s has stopped [192; 426; 427]."
And as previously noted, Curry endorsed [2; 3] Tsonis' position on climate shifts:
"A year earlier, Jan 2011, I made it pretty clear that I supported Tsonis’ argument regarding climate shifts and a flat temperature trend for the next few decades [...] [2]."
"Attention in the public debate seems to be moving away from the 15-17 yr ‘pause’ to the cooling since 2002 (note: I am receiving inquiries about this from journalists). This period since 2002 is scientifically interesting, since it coincides with the ‘climate shift’ circa 2001/2002 posited by Tsonis and others. This shift and the subsequent slight cooling trend provides a rationale for inferring a slight cooling trend over the next decade or so, rather than a flat trend from the 15 yr ‘pause’ [3]."
Yet figure 6 shows the ongoing failure of Curry [2; 3] and Tsonis' forecast [190, page 4; 191, paragraphs 14 and 15; 192 - 194; 426; 427], since the warming of the 1980s and 1990s continued through the 2000s and 2010s. To borrow an apt point from tamino, a.k.a the statistician Grant Foster, who co-authored peer-reviewed papers on temperature trends [66; 104; 110; 199; 245; 335] and other climate-related topics [659 - 661], repeatedly debunked Curry's nonsense [241 - 244], and pointed to evidence of a possible recent acceleration in global climate change as of 2019 [559; 671; 984 (with 1058, 1059, and 1064)] (as did others [442; 445; 841; 842; 843, confirmed using 76, along with 849 and 850 (generated using 152, as per 153); 845 - 848; 851; 938; 939, confirmed using 76, along with 940 and 941 (generated using 152, as per 153); 1097; 1120 - 1122]):
"Global Warming: When Judith Curry makes a claim, check for yourself [241]"
If only more of Curry's defenders and followers bothered to do that.
We need to put down the IPCC as soon as possible – not to protect the patient who seems to be thriving in its own little cocoon, but for the sake of the rest of us whom it is trying to infect with its disease [10]."
"Well thank you IPCC authors [includes: Kevin Trenberth, Susan Solomon, Ben Santer, and Judith Lean] for letting us know what is really behind that “very likely” assessment of attribution 20th century warming [sic]. A lot of overbloated over confidence that cannot survive a few years of cooling. The light bulbs seem to be just turning on in your heads over the last two years [932]."
"When I refer to the IPCC dogma, it is the religious importance that the IPCC holds for this cadre of scientists; they will tolerate no dissent, and seek to trample and discredit anyone who challenges the IPCC. Who are these priests of the IPCC? [...] These scientists have used to IPCC to gain a seat at the “big tables” where they can play power politics with the collective expertise of the IPCC, to obtain personal publicity, and to advance their careers [12]."
"Climatology has become a political party with totalitarian tendencies [...]. If you don’t support the UN consensus on human-caused global warming, if you express the slightest skepticism, you are a ‘climate-change denier,’ a stooge of Donald Trump, a quasi-fascist who must be banned from the scientific community [1056, with 1057]."
 |
Figure 5: A cartoon Judith Curry posted at the the end of a blogpost in which she argued that climate scientists at the UN's IPCC over-estimate anthropogenic (human-made) global warming caused by increased greenhouse gases [11]. |
To borrow her terminology: Curry resorts to toxic rhetoric on climate change [998]. Curry's defenders should heed her advice to "read what [she] write[s] [806]," so they understand why scientists debunk [183; 187; 242; 360; 372; 487 - 494; 553 - 555; 953 - 955; 961; 975; 976; 1044, page 1148; 1046 - 1049; 1053, citing 1054 and 1055; 1094; 1095; 1129] (or ignore) Curry in the way they do; see section 2 of "Myth: Judith Curry Fully and Accurately Represents Scientific Research" for more on this.
As we move into the third decade of the 21st century, one might hope that people would stop peddling Curry's nonsense. But I doubt reality will fulfill that hope. In my experience [368 and 1149, with subsequent tweets listed as replies to them], many of the people who approvingly cite Curry in online discussions do not honestly care if evidence supports her claims. Instead they cite Curry for some of the same reasons other science denialists, such as HIV/AIDS denialists and the tobacco industry's defenders, cite contrarian scientists. These reasons include [346 - 356; 362 - 365; 366, from 1:39:29 to 1:40:21; 367; 706; 899; 1152; 1174, page 7]:
- creating a false narrative in which mainstream science oppresses "heretic" scientists in a religious fashion [369 - 371; 376; 885, with 886 and 946 - 949] (this denialist talking point is especially ironic, since Curry advocated euthanizing the IPCC, leading others to say "Kill the IPCC" [10])
- inventing paranoid conspiracy theories about mainstream scientists holding to their views just for the sake of government/grant funding, prestige, ideology, dogma, etc. [370; 371; 373; 375; 376]
- manufacturing false doubt and exaggerating uncertainty about science in order to avoid science being used to support policies/ideologies they dislike [369; 373 - 375] (consistent with the ideologically-motivated science denialism discussed in section 2.1 and supplementary section 2.4 of "Myth: Science Denialism is as Rampant Among Liberals as Among Conservatives", and in "Myth: Judith Curry Fully and Accurately Represents Scientific Research"; I cover this motivation more in response to objection 9 in section 2.2)
I expect that such reasons will motivate many people to continue spreading Curry's debunked claims and to continue investing undue trust in her, just as those reasons continue to motivate other science denialists [346 - 356; 362 - 365; 366, from 1:39:29 to 1:40:21; 367; 706; 899; 1152; 1174, page 7] to rely on contrarian/denialist sources. I elaborate on these motivations in response to objection 9 in section 2.2. And just as those reasons drive many of Curry's defenders [369 - 371; 373 - 375; 376; 885, with 886 and 946 - 949], those same reasons propel Curry as well, as per the above quotes [10 - 12; 932; 1056, with 1057] from her.
So I also do not expect Curry to admit she was wrong on her temperature trend claims, despite the fact that she is well-aware that post-1998 and post-2002 warming occurred [232, page 40; 249; 316; 1180]. After all, a continuing, significant pause/hiatus remains central to her position, as I discuss in response to objections 7, 8, and 9 in section 2.2. Therefore, admitting no such pause/hiatus exists, and that her IPCC-wrong forecast failed, greatly undermines her position. In fact, Curry offered the following false claim on October 16, 2019, without bothering to provide any evidence for her claim:
"Early predictions of warming were 0.2 to 0.3 degrees Centigrade per decade are too high relative actual observation. [...] Define ‘early’. My definition of ‘early’ does not include 2018. Try FAR, SAR, TAR, AR4 [the IPCC's First, Second, Third, and Fourth Assessment Reports, respectively] [383]"
In December 2019 she also doubled-down on her continuous-hiatus forecast [5; 9; 14; 57; 1188] of less than 0.10°C/decade of warming [18; 242], by predicting ~1.0°C of "business as usual" warming for the 21st century until 2100 [497]. Curry attempts to justify this forecast by using [497] a blogpost from her colleague Nic Lewis [625] to cherry-pick a low, outlier value for shorter-term climate sensitivity (e.g. a low value for how much the climate warms in response to changes in greenhouse gases such as carbon dioxide). I critique Lewis+Curry's low estimate in sections 2.5 and 2.7 of "Myth: Attributing Warming to CO2 Involves the Fallaciously Inferring Causation from a Mere Correlation"; other sources reach support a higher value for shorter-term climate sensitivity [36; 158; 626, figure 1; 627 - 634], further undermining Curry's borderline hiatus forecast of ~1°C of 21st century warming [497].
In 1993, the contrarian Matt Ridley also attempted to justify a prediction of ~1°C/century of warming [644 - 648; 699; 700; 702; 1113; 1114], while later casting doubt on the IPCC's model-based projections [649; 650; 699]. To make his claim, Ridley uses both surface analyses and satellite-based bulk atmospheric analyses [644], the latter of which I address in response to objection 3 in section 2.2. The average of the two satellite-based analyses, both of which under-estimate recent warming [35, page S17; 46, figure 10; 47, page 7715; 48] (as admitted by one of the satellite-based research teams [35, page S17; 47, page 7715; 48]), shows ~1.8 times more warming than Ridley predicted [644 - 648; 699; 700; 702; 1113; 1114]. With respect to the surface analyses, the analyses with greater global coverage show about double the rate of warming [76; 685 - 687; 724 - 727, generated using 152, as per 153] Ridley forecasted [644 - 648; 699; 700; 702; 1113; 1114], and the analyses with less global coverage show ~1.7 times more warming [76; 698; 728, generated using 152, as per 153]. MERRA-2 and CFSR [729, generated using 152, as per 153] are two outliers on this that under-estimate warming for the reasons noted earlier in this section, though even MERRA-2 shows ~1.6 times as much post-1993 warming [729, generated using 152, as per 153] as Ridley predicted [644 - 648; 699; 700; 702; 1113; 1114].
In addition to Ridley, the contrarians Ryan Maue and Patrick Michaels misleadingly defend [614] Curry's ~1°C/century forecast [497]. To do this, they remove recent warming from the JRA-55 analysis to make it appear as if JRA-55 shows post-1979 warming trend of 0.10°C/decade [614; 615]. Yet JRA-55 actually shows a trend of 0.17 +/- 0.03°C/decade [615; 624, generated using 152, as per 153]. So Maue and Michaels' own source further undercuts [615; 624, generated using 152, as per 153] the ~1°C projection they [614] and Curry [497] defend.
(Funnily enough, Ridley [1011; 1018], Curry [372 (cited by 501 and 502); 602; 616; 617], and Maue's co-author [614] Michaels [1012, from 14:19 to 16:11; 1013; 1014] either directly profit from the fossil fuel industry or receive funding from the fossil fuel / energy industries. Michaels and Maue also made their temperature trend claims in a document [614] for the Cato Institute, a fossil-fuel-industry-funded [1015 - 1017] organization. Of course, it may just be a coincidence that fossil-fuel-funding surrounds these four individuals who inaccurately downplayed human-made greenhouse-gas-induced warming.)
The dubious projections of Michaels, Maue [614], Curry [497], and Ridley [644 - 648; 699; 700; 702] contrast with more mainstream estimates of another ~2°C of "business as usual" warming during the 21st century [500; 675; 740; 926]. This ~2°C projection makes sense in light of the accelerated post-1960s warming in figure 1 above, the more global (non-outlier) post-1998 and post-2002 warming trends in figures 2, 3, and 4 above, the ~0.2°C/decade post-1970s warming trend in figure 6 below, and the ~0.2°C/decade post-1990 warming trend shown in figure 4 of section 2.1 of "Myth: The IPCC's 1990 Report Over-estimated Greenhouse-gas-induced Global Warming". Moreover, as previously mentioned, Berkeley Earth stated warming continued at 0.19°C/decade [675; supported by 76 and 826 (generated using 152, as per 153)], while the IPCC's 2018 Special Report similarly noted that human-made global warming continues at a rate of 0.2°C/decade. And unlike Curry, the IPCC actually cited evidence backing up its statement on what the current global warming trend is [378, pages 4 and 57 - 59].
So despite the scientific evidence rebutting Curry's forecasts, Curry just extends her claims further into the future through the 21st century [13; 14; 247; 414; 497; 861; 863; 1175; 1176] to mislead more people and unjustifiably downplay human-induced climate change [5; 7; 14; 57; 98; 497; 498 (with 383); 499; 1154 (with: 1155; 1156); 1157; 1160 (with 1161)]. Thus the failure of temperature trend forecasts from contrarians such as Curry, Michaels, Maue, and Ridley, gives one every reason to doubt their predictions for the future; similarly, the accuracy of the IPCC's temperature trend forecasts should increase one's confidence in the IPCC's future predictions.
Interestingly, beginning in 2017, Curry, as far I can tell, stopped publicly evaluating up-to-date temperatures analyses to see if her supposed pause/hiatus still existed [731 (from 233, compare: 607, 664 - 666; to: 176; 313; 314; 663)]. This contrasts with her behavior from 2011 - 2015, when she frequently discussed the pause/hiatus and presented temperature trends [2 - 5; 7 - 9; 10; 18; 19; 57; 97; 98; 313; 314], as per supplementary section 2.2. Post-2015, Curry says one should wait for several years before seeing if the pause continued [13], simply assumes (without presenting evidence) that the hiatus continued, that it may go on for decades [14; 247], that one should expect another hiatus [414], and that one should expect very limited 21st century human-made global warming [497]. She thus moves the goalposts to avoid falsification of her predictions, as per my response to objection 4 in section 2.2.
The ERA-I / ERA5 research team [1044, page 1148, citing 1045], and the climate scientist Robert Way [490; 1046, with 1047; 1048; 1049], also note that Curry mentions [1045] re-analyses without substantively commenting on the meaning of their trends, when those trends support larger estimates of warming. Curry even went so far as to repeatedly block comments that showed recent warming rebutted her claims on a hiatus [415; 416]. When she later allowed other criticisms through, her response did nothing to show her forecasts were accurate [383; 859; 860; 863]. And Curry went back to knowingly concealing evidence that rebutted her forecasts, even though the evidence met the specifications she requested [951, with 950 and 960]; I discuss this further in response to objection 5 in section 2.2.
To further illustrate Curry's evasiveness, first note that as of January 16, 2020, Curry wrote on her website that her "views on climate change are best summarized by [her] recent Congressional Testimony [233]." So one could plausibly construe this testimony as representing the evolution of her stated position. On her website she then lists nine examples of her testimony, spanning the decade from 2010 - 2019 [233]. They are, in chronological order:
- 2010, one instance of testimony : She makes no mention of a pause/hiatus in global warming [662].
- 2013, one instance of testimony : Curry twice notes that there is an ongoing hiatus/pause. She does not claim it causes a problem for climate models nor the IPCC's position [314].
- 2014 - 2015, three instances of testimony : Curry mentions an ongoing pause/hiatus at least half a dozen times each time she testifies, claiming that the pause/hiatus creates a problem for climate models and the IPCC's position [176; 313; 663].
- 2017 - 2019, four instances of testimony : She makes no mention of an ongoing pause/hiatus [607; 664 - 666]. She notes a pause/hiatus one time during this period, saying it occurred in the early 21st century, without stating whether it is ongoing nor whether it creates a problem for climate models and the IPCC's position [664, page 7].
To make matters worse: in January and February 2020, after being shown evidence of post-1998 and post-2002 global warming, she expressed surprise that anyone would claim she said global warming "stopped" in 1998 [668; 703; 705]. Yet it took very little time for people to find out [669; 704] she actually said it [7; 670; 680; 1112]. So Curry continues to retreat from her previous claims, without admitting she was wrong. She even tries to cite the IPCC to defend her hiatus claims [668; 705]; I debunk this ludicrous defense in response to objection 6 in section 2.2. The supposed pause/hiatus thus went from being, in Curry's words from 2012 and 2013, "the heart of the recent scientific debate on climate change [1148]," and "the most important issue in the public debate on climate science, for well over a year now [678]," to now being something she scarcely mentions. To appropriate a phrase Curry applied to the IPCC [678]: one might wonder how Judith Curry forgot to mention the pause.
So what could explain Curry's above post-2015 / post-2016 shift, where she sharply curtails her discussion of a supposed pause/hiatus [731 (from 233, compare: 607, 664 - 666; to: 176; 313; 314; 663)]? Well, one might suspect Curry is running from addressing the post-2015 warmer period shown in figures 6, 8, 9, and 10, lest she have to admit she was wrong in her temperature trend forecasts:


 |
Figure 6: (First panel) Global surface temperature trend from 1850 - 2019, relative to a baseline of 1850 - 1900 [682, with 977]. A number of other sources [596; 675; 683; 684; 732], included published studies [62, figure 3; 162, figure 1; 403, figure 1b; 609, figure 13; 679, figure 8 (with: 1165)], offer an analysis similar to this top panel. Thanks in particular to Jim Java on Twitter for graciously providing an alternative version of this image that includes numerous other surface temperature analyses [596]. (Second panel) 1859 - 2018 decadal average of relative global surface temperature trend from various observational analyses. The colored bars represent the range of average relative temperature values for the decade preceding the bar. For example, the pink bar just before 1870 represents the range for 1859 - 1868 for HadCRUT4, while the blue bar just before 2020 represents the range from 2009 - 2018 for ERA5. The colored boxes overlap with one another, such that the full range of values is often obscured. For instance, the yellow GISSTEMP / GISTEMP bar just before 2010 obscured the full range of values for the blue ERA5 bar. The dark gray boxes and light gray boxes represent the HadCRUT4 upper limit and lower limit, respectively, for the decadal average for HadCRUT4 (these correspond to the 2.5% confidence limit and 97.5% confidence limit) [597]. Other sources show a similar trend of decadal averages running through 2019 [683; 896, figure 3; 897; 898; 918, pages 4 and 5]. (Third panel) Global surface temperature trend from 1850 - 2019, relative to a baseline of 1850 - 1900, for the Berkeley Earth analysis [675; supported by 76 and 826 (generated using 152, as per 153)]. Vertical lines for each blue annual average represent the 95% confidence limit for relative temperature for that year. The dashed black line represents the warming trend of 0.19°C/decade since 1980. This warming rate "has changed little [675]" during the post-1980 period. Projecting this rate into the future results in 1.5°C of warming above 1850 - 1900 levels by around 2036, and 2.0°C of warming by around 2063. The Paris Agreement on Climate Change seeks to limit warming to beneath these targets, as noted on the Berkeley Earth page this panel is taken from [675] (coverage of instrumental analyses used, the baseline time-period from which warming is estimated, etc. each impact when these warming thresh-holds are crossed [380; 390; 735; 983]). This Berkeley Earth page also notes that human-made increases in greenhouse gases drove this 0.19°C/decade warming trend [675]; other sources make a similar point [37, as per 36; 387; 455; 456; 459; 461; 752 - 754; 755, figure 8.18 on page 699; 851], consistent with figure 8 below and "Myth: Attributing Warming to CO2 Involves the Fallaciously Inferring Causation from a Mere Correlation". Extending the projection to 2100 results in ~2.7°C above 1850 - 1900 conditions, and ~1.9°C of 21st century warming. This contrasts with the more extreme, accelerated warming scenario in the fourth panel [851]. A similar version of this analysis exists from the beginning of 1970 to the end of 2019 for GISSTEMP / GISTEMP [163; 732; 825; 896], Cowtan+Way, NOAA, and HadCRUT4 [732]. For this 50 year period, Berkeley Earth, GISTEMP, and C+W with HadSST4 show a warming trend of 0.19°C/decade (for C+W with HadSST4, the trend is to the end of 2018, not 2019), while Cowtan+Way, NOAA, HadCRUT4, and JRA-55 have a trend of 0.18°C/decade [76, with 982; 733, 734, and 854, generated using 152, as per 153]; ERA5 [35, pages S18 - S19; 178 - 182; 1166] and NCEP-2 [978, generated using 152, as per 153] do not yet extend to before 1979, so they are not included. NCEP-1 [979 - 981], NCEP-2's predecessor [585; 586], also shows a 1970 - 2019 warming trend of 0.18°C/decade [978, generated using 152, as per 153]. And ~1.0°C of global surface warming occurred from 1964 - 2019 at a rate of ~0.17°C/decade [76; 985 - 987, generated using 152, as per 153]. Figure 1 above shows that this rate of warming is about 3 times greater than the largest pre-industrial warming trends of the past 2000 years. This panel under-estimates recent global warming for at least two reasons. First, Berkeley Earth under-estimates Arctic warming [73; 1024]. Second, Berkeley Earth uses sea surface temperature trends from the Hadley Centre Sea Surface Temperature analysis version 3 (HadSST3) [66, section 3.1; 983, table 1; 1019 - 1021]. HadSST3 under-estimates recent warming [38, table 1; 50, compared to 51 and 601; 66, section 3.1; 437, with 571 and 1010]; the update to HadSST3, HadSST4, fixes this issue [437, with 571 and 1010]. This helps explain why this panel fails to show recent acceleration, while analyses such as HadOST (see figure 8), ERA5 [559 and 671, confirmed using 1071 - 1073 (generated using 152, as per 153); 984 (with 1058, 1059, and 1064)], GISTEMP [671, confirmed using 1071 - 1073 (generated using 152, as per 153); 843, confirmed using 76, along with 849 and 850 (generated using 152, as per 153); 939, confirmed using 76, along with 940 and 941 (generated using 152, as per 153); 984 (with 1058, 1059, and 1064)], NOAA [671, confirmed using 76, along with 1074 - 1076 (generated using 152, as per 153); 984 (with 1058, 1059, and 1064)], NCEP-2 [984 (with 1058, 1059, and 1064); 1074 - 1076, generated using 152, as per 153], and 20CR [1109 - 1111, generated using 152, as per 153] show acceleration. (Fourth panel) Ramanathan et al.'s comparison of 2000 - 2017 global surface temperature, relative to a baseline of 1850 - 1900 [851], vs. a continuation of the IPCC's ~0.2°C/decade warming projection [45, page 1010; 159, page 7; 836, section 3.2 on page 45], and vs. a model-based accelerated warming scenario. Other research makes a similar point on projected accelerated warming [999 (with: 1000 - 1003; 1130; 1131; 1153, supplemental figure S6e)]. The extreme, accelerated warming scenario involves a representative concentration pathway [851], or RCP, in which humans emit large amount of greenhouse gases [45, figure 11.25b on page 1011]; this particular scenario is known as RCP8.5. It contrasts with the depicted IPCC projection, the linear projection from the third panel [675], and business as usual forecasts from other sources [500; 740; 926]. 2019 relative temperature falls on the red line for the accelerated scenario, as per the first and third panels, and 2020 so far remains consistent with this accelerated projection [675; 864 - 866; 876; 973; 974; 1138; 1150; 1162; 1163]. However, more time needs to pass before one can tell whether warming will remain on the accelerated projection. The Paris Agreement on Climate Change seeks to limit this warming trend to keep warming beneath the 1.5°C limit shown here [380; 675; 735; 851; 983], just as in the third panel [675]. "Observations" for global surface temperature come from NASA's GISTEMP analysis [851]. See the IPCC's 2018 Special Report for a related comparison with RCP8.5 model-based projections [378, figure 1.2 on page 57]. The four panels of this figure together depict results from two re-analyses and four instrumental analyses [597; 675; 682]. The re-analyses are the Japan Meteorological Agency's 55-year Re-analysis (JRA-55) [581 - 584], and the European Centre for Medium-Range Weather Forecasts' Re-analysis 5 (ERA5) [35, pages S18 - S19; 178 - 182; 1166], the latter of which serves as the recent update to the European Centre for Medium-Range Weather Forecasts' (ECWMF's) Interim re-analysis (ERA-I) [35, pages S18 - S19; 178 - 182; 1166]. The instrumental analyses are HadCRUT4 from the Hadley Centre of the United Kingdom Met Office and the Climatic Research Unit of the University of East Anglia [59], the Goddard Institute for Space Studies Surface Temperature analysis (GISSTEMP / GISTEMP) from NASA [595], the NOAA's global analysis [75; 609], and the Berkeley Earth Surface Temperature analysis [380; 563]. Judith Curry recommends using re-analyses in general [16; 18 - 20; 681; 925; 927], while lauding ERA-I, ERA5, and ECMWF's work [18; 20; 681; 925; 927]. Curry further reported confidence in the Berkeley Earth [303; 337] and HadCRUT analyses [303]; she formerly worked with Berkeley Earth on their analysis [333; 334; 337] and expressed pleasure in how it turned out [337]. And in her published work she cites trends from HadCRUT4 [550, section 3.3; 551, section 3c; 552]. HadCRUT4 under-estimates recent warming due to its poorer coverage of the globe [52; 61; 62, section 4; 63, figure 1, sections 4.2.2 and 4.2.3; 64 - 74; 378, page 57; 380; 402, cited by 412; 608, section 2b on page 4681], as admitted by members of the Hadley Centre team [70]; in particular, HadCRUT4 under-estimates warming in the Arctic [52; 61 - 74; 378, page 57; 380; 402], one of the most rapidly warming regions on Earth [52; 65; 177; 390; 403, figure 2; 404 - 406; 1024; 1085; 1086]. The top three panels of this figure may overestimate 1940s - 1970s cooling due to uncertainties tied to changes in temperature monitoring practices during World War II [36 - 39; 107; 393, figure 4; 448, figure 8; 476; 601; 935; 936, with 388, figure 3b], as I discuss in "Myth: Karl et al. of the NOAA Misleadingly Altered Ocean Temperature Records to Increase Global Warming". Figure 8 below addresses this issue. |
Figure 6 also stands in stark contrast to Anastasios Tsonis' claim that climate shifted [190, page 4; 191, paragraphs 14 and 15; 192 - 194; 426; 427] such that the warming of the 1980s and 1990s would not continue. As Tsonis is quoted as saying in 2013:
"We are already in a cooling trend, which I think will continue for the next 15 years at least. There is no doubt the warming of the 1980s and 1990s has stopped [192; 426; 427]."
And as previously noted, Curry endorsed [2; 3] Tsonis' position on climate shifts:
"A year earlier, Jan 2011, I made it pretty clear that I supported Tsonis’ argument regarding climate shifts and a flat temperature trend for the next few decades [...] [2]."
"Attention in the public debate seems to be moving away from the 15-17 yr ‘pause’ to the cooling since 2002 (note: I am receiving inquiries about this from journalists). This period since 2002 is scientifically interesting, since it coincides with the ‘climate shift’ circa 2001/2002 posited by Tsonis and others. This shift and the subsequent slight cooling trend provides a rationale for inferring a slight cooling trend over the next decade or so, rather than a flat trend from the 15 yr ‘pause’ [3]."
Yet figure 6 shows the ongoing failure of Curry [2; 3] and Tsonis' forecast [190, page 4; 191, paragraphs 14 and 15; 192 - 194; 426; 427], since the warming of the 1980s and 1990s continued through the 2000s and 2010s. To borrow an apt point from tamino, a.k.a the statistician Grant Foster, who co-authored peer-reviewed papers on temperature trends [66; 104; 110; 199; 245; 335] and other climate-related topics [659 - 661], repeatedly debunked Curry's nonsense [241 - 244], and pointed to evidence of a possible recent acceleration in global climate change as of 2019 [559; 671; 984 (with 1058, 1059, and 1064)] (as did others [442; 445; 841; 842; 843, confirmed using 76, along with 849 and 850 (generated using 152, as per 153); 845 - 848; 851; 938; 939, confirmed using 76, along with 940 and 941 (generated using 152, as per 153); 1097; 1120 - 1122]):
"Global Warming: When Judith Curry makes a claim, check for yourself [241]"
If only more of Curry's defenders and followers bothered to do that.
Below are some possible objections to my critique of Curry's forecasts in section 2.1, along with my rebuttal of those objections:
Response 1: Curry said scientists should use re-analyses to investigate surface temperature trends [16; 18 - 20; 681; 925; 927]; she specifically highlighted ERA-I and ERA5 as re-analyses to use [18; 20; 681; 925; 927], as per supplementary section 2.1. Hence my use of ERA-I and ERA5 in section 2.1. Curry also expressed confidence in the Berkeley Earth [303; 337] and HadCRUT4 analyses [303], along with relying on HadCRUT4 [550 - 552], Cowtan+Way [551, section 3c; 552], and other instrumental analyses in her peer-reviewed work [550 - 552]. So objection 1 conflicts with Curry's position on surface analyses, even as the objection seeks to defend Curry.
Recent surface warming also remains evident in not only the vast majority of instrumental analyses and re-analyses discussed in section 2.1, but also in satellite-based analyses of surface warming [49 - 52; 676; 684, using 52; 918, page 11, using 52; 1066, with 76 (and 1067, generated using 152, as per 153)] and increasing geopotential height due to thermal expansion of the lower atmosphere [1132 - 1134, generated using 152, as per 153 (with 1135 - 1137)]. Thus there exist consilient/convergent lines of evidence supporting the stated warming trend. Such consilience further increases the likelihood that the observed trend is real [50; 81, pages 14, 42, 120, and 122; 91, from 6:10 to 7:36; 132; 561; 562; 1125], especially when non-experts examining the raw data replicated the results of mainstream analyses such as HadCRUT and the NOAA's global analysis [905 - 911; 912, sections 6.3 and 6.4 on pages 45 - 49; 952; 962]. Scientists also tested and validated the data adjustment procedures used in surface temperature trend analyses [ex: 61; 963, page 9840; 964 - 971; 1087]. And recent global warming occurred not only in surface temperature records, but was also reflected in deep ocean warming, bulk atmospheric (tropospheric) trends from satellite-based analyses and weather balloons, ice melt, sea level rise acceleration, etc., as shown in "Myth: No Global Warming for Two Decades".
One would need to be pretty deluded and hopelessly paranoid to claim scientists and non-experts faked all these signs of warming; many contrarians/denialists display this sort of conspiracist ideation when it comes to climate science [346; 347; 349 - 356; 397; 673; 899; 1174]. That sort of reasoning would run afoul of the flaws discussed in section 3.1 of "John Christy, Climate Models, and Long-term Tropospheric Warming", including the reasoning:
- illegitimately evading falsification by fabricating an evidence-free, paranoid conspiracy theory in order to avoid any inconvenient evidence
- resorting to cascade logic, in which an implausibly large number of people need to be involved in the conspiracy
- engaging in special pleading, by applying a double-standard in which the objection's proponents (for no good reason) treat evidence in climate science differently from evidence in other scientific fields
Objection 2: An ocean cycle known as the El Niño–Southern Oscillation (ENSO), or other natural factors, caused recent 21st century warming [1035] (see: "Myth: El Niño Caused Post-1997 Global Warming"). So section 2.1 cannot appeal to such warming to rebut Curry's predictions, since Curry targets IPCC forecasts of human-made non-natural warming.
Response 2: This objection conflates finding a temperature trend (detection) with determining what caused that trend (attribution) [270; 325 - 329; 360]. Curry failed on forecasting with respect to detection, since she predicted no warming when warming actually occurred, or forecasted less warming than occurred. Discussing attribution does not remedy this failure on detection, so objection 2 fails.
And Curry further undermined this objection when she said the IPCC's view entails that the hiatus would end with the next El Niño [5], while her stadium wave hypothesis entailed a continuing-hiatus forecast for at least another decade [5; 9; 417]. Since Curry admitted the 2015/2016 El Niño led to record warm years [232, page 40; 249; 1180], her words imply that the IPCC was right about the hiatus, while she was wrong. Thus warming from El Niño warming actually rebuts Curry's position. This becomes even more apparent when one examines Curry's chosen start-points for her supposed pause/hiatus.
Curry's selects time-periods that begin on, or soon before, an El Niño year [2; 3; 7; 13; 18; 98], in which the warm El Niño phase of ENSO causes temporary surface warming [94; 310; 312; 332]. So her post-1998 forecasts [7; 13; 18; 98] start with the strong 1997/1998 El Niño [94; 95; 332; 336 and 701, generated using 152, as per 153], while her post-2002 trend [2; 3] begins with the 2002 El Niño [94; 95; 332; 336 and 701, generated using 152, as per 153]. Moreover, as per supplementary section 2.2, Curry hyped her claims of a supposed pause/hiatus when her end-points were [2 - 5; 7; 10; 57; 97; 98; 314] during, or soon after, La Niña conditions [94; 95; 332; 336 and 701, generated using 152, as per 153], in which the cold La Niña phase of ENSO causes temporary surface cooling [94; 310; 312; 332]. In fact, a large proportion of her claims of a pause/hiatus came during a 2011 - 2014 period [2 - 5; 7; 10; 57; 97; 98; 314] with particularly strong La Niña conditions [94; 95; 332; 336 and 701, generated using 152, as per 153], as per figure 7 below:
 |
Figure 7: Multivariate El Niño–Southern Oscillation index (MEI). The red peaks represent El Niño events and the blue troughs represent La Niña events. The relative magnitudes of the peaks and troughs are proportional to the strength of corresponding El Niño and La Niña events [94; 95; 336 and 701, generated using 152, as per 153]. |
Curry therefore conveniently cherry-picked a short time-frame [2; 3; 7; 13; 18; 98] in a way that allowed El Niño to strongly skew her temperature trend downwards [61; 109, section 3.3; 123; 156, page 25; 157; 229, page 162]. That is akin to cherry-picking a start-point at midday in Canada's winter, an end-point at midnight 2 weeks later, and then using that to claim a pause/hiatus in a multi-month Canadian warming trend from winter to summer (to borrow an analogy from potholer54, a.k.a the geologist Peter Hadfield [301, from 5:22 - 11:22]). One could correct for that time-of-day cherry-picking by choosing time-points that both start at midday, just as one could (at least partially) correct for Curry's cherry-picking by selecting a start-point and end-point near similar ENSO conditions. Curry admits this [859]. The 2015/2016 El Niño from figure 7 created ENSO conditions similar to Curry's 1998 start-point, thereby putting to rest Curry's ability to cherry-pick in this way. This may explain why Curry became remarkably quiet about her supposed pause/hiatus post-2016, as I discussed in section 2.1.
So consideration of El Niño actually undercuts Curry's position, by instead arguing in favor of looking at trends that include the 2015/2016 El Niño. And as Curry herself notes, if she was trying to identify human-made warming, then she would choose a start-point that is ENSO neutral, instead of a strong El Niño year [97]. Therefore, by Curry's logic, since she started her post-1998 and post-2002 trends on El Niño years, she had not adequately assessed human-made warming. She even explicitly states that her hiatus claims were not meant to disprove the existence of AGW [1140]. Objection 2 thus again fails when it claims Curry's focus was just on human-made trends.
Moreover, even if one removes the effect of ENSO, post-1997, post-1998, and post-2002 warming remains, as shown in "Myth: El Niño Caused Post-1997 Global Warming". This contradicts objection 2's attempt to attribute the warming to just ENSO. Figure 8 below depicts this with respect to attribution of surface temperature trends to various factors, accounting for solar and volcanic factors, as Curry herself requested [859]:
 |
| Figure 8: Relative global surface temperature trend from 1850 - 2017 (observations, for HadOST), with the contribution of various factors to this temperature trend (colored lines) [36; 37]. The gray line is the sum of each of the depicted colored lines. The surface temperature trend takes into account changes in sea surface temperature measuring practices during the 1930s and 1940s [36 - 39; 107; 393, figure 4; 448, figure 8; 476; 601; 935; 936, with 388, figure 3b], which I elaborate more on in "Myth: Karl et al. of the NOAA Misleadingly Altered Ocean Temperature Records to Increase Global Warming". The authors of this figure adapted it from the results of their 2019 paper [36; 37; 428; 1117, with 1118]. This figure displays global warming acceleration post-1998. Post-1998 acceleration also appears in global surface temperature trend analyses such as ERA5 [559 and 671, confirmed using 1071 - 1073 (generated using 152, as per 153); 984 (with 1058, 1059, and 1064)] (which is endorsed by the contrarians Judith Curry [681; 925; 927] and Ryan Maue [21; 239]), NASA's GISTEMP [671, confirmed using 1071 - 1073 (generated using 152, as per 153); 843, confirmed using 76, along with 849 and 850 (generated using 152, as per 153); 939, confirmed using 76, along with 940 and 941 (generated using 152, as per 153); 984 (with 1058, 1059, and 1064)], NOAA's global analysis [671, confirmed using 76, along with 1074 - 1076 (generated using 152, as per 153); 984 (with 1058, 1059, and 1064)], NCEP-2 [984 (with 1058, 1059, and 1064); 1074 - 1076, generated using 152, as per 153], and 20CR [1109 - 1111, generated using 152, as per 153], consistent with other sources on accelerating climate change [442; 445; 841; 842; 845 - 848; 851; 938; 999 (with: 1000 - 1003; 1130; 1131; 1153, supplemental figure S6e); 1097; 1120 - 1122]. See section 2.1 for further discussion of accelerating warming. The trend from this figure [37, as per 36], along with other research [387; 452 - 475; 752 - 754; 755, figure 8.18 on page 699], also rebuts Curry's false claim that global warming from anthropogenic (human-made) greenhouse gases started in the late 1970s or 1980 [451; 667]. Curry's false claim involves leaving out about half of the human-made warming effect, and about third of the warming, up to 2017. Her claim also contradicts her published research, in which she attributes the vast majority of the industrial-era warming to human-made increases in greenhouse gases [489; 550; 551; 835]. |
Objection 3: Curry said satellite-based trends were the best data we have [85, from 4:30 to 4:36; 176], that they show the hiatus [18; 247] / pause [13], and that they are the strongest evidence of a significant hiatus [18]. Yet the trends from section 2.1 examined were not satellite-based. Curry also said that evidence for a pause or stop in warming could be found in post-2002 ocean heat content data from a depth of 0 meters to 700 meters, or in the post-1998 sea surface temperature trend from the Extended Reconstructed Sea Surface Temperature (ERSST) analysis [97]. But section 2.1 failed to cover these trends as well. So section 2.1 failed to examine the data most relevant to Curry's claims.
Response 3: Ocean heat content shows a statistically significant warming trend [105; 438 - 447; 1119] that climate models accurately represent [442; 446; 736 - 739; 1151]; thus deeper ocean warming does not support Curry's claims of a stop/pause [97], as covered in "Myth: No Global Warming for Two Decades". And ERSST undermines Curry's claim of a stop/pause [97] by showing statistically significant post-1998 warming [50; 51; 432, generated using 152, as per 153; 433 - 437], as shown in "Myth: Karl et al. of the NOAA Misleadingly Altered Ocean Temperature Records to Increase Global Warming". Satellite-based analyses of surface warming also confirm surface trends from instrumental records [49 - 52; 676; 684, using 52; 918, page 11, using 52]. So these satellite-based analyses further undermine Curry's position.
Moreover, Curry's predictions from section 2.1 were for surface trends [7]; hence her references [7; 18; 97; 98; 232, pages 39 - 40; 677] to the IPCC's forecasts for surface trends [45, page 1010 and figure 11.25b on page 1011; 159, page 7; 160, page 763; 836, section 3.2 on page 45], and her references [2; 3] to Tsonis' [190, page 4; 191, paragraphs 14 and 15; 192 - 194; 426; 427] claims on surface trends. But the satellite-based analyses she often refers to [13; 18; 85, from 4:30 to 4:36; 176; 247] from the University of Alabama in Huntsville (UAH) and Remote Sensing Systems (RSS), focus on the bulk lower troposphere, not the surface [35, pages S17 and S18; 47; 84; 135]. Comparing surface trends to bulk tropospheric trends would constitute an apples-to-oranges comparison, as admitted by UAH team member Roy Spencer [80]. So objection 3 engages in a misleading apples-to-oranges comparison of bulk tropospheric trends to Curry's claims on surface trends.
The RSS and UAH lower tropospheric analyses suffer from their own problems. For instance, RSS and UAH are the only two oft-cited research groups generating satellite-based, lower tropospheric warming estimates [35, pages S17 and S18; 84, figure 8 on page 77] (there is a third group who's analysis shows much more warming than RSS and UAH [82], but that group is not cited much [35, pages S17 and S18; 83; 84, figure 8 on page 77]). This becomes problematic since the more research groups there are, the greater the chance that at least one group will identify any mistakes, as acknowledged in a report co-authored by UAH team member John Christy [81, pages 14, 42, 120, and 122]. In contrast to satellite-based lower tropospheric analyses, many more research groups generate surface analyses, as shown in section 2.1, offering a better chance for mistakes to be identified and corrected.
The RSS and UAH lower tropospheric estimates also differ more from each other more than do surface estimates; and these lower tropospheric estimates change by a fairly large amount between different versions of the RSS and UAH analyses, given the adjustments that come with each new version [47; 84; 136]. Consistent with this, RSS' Carl Mears notes that the satellite-based tropospheric temperature trend record comes with greater uncertainty than the surface temperature trend record [85, from 1:37 to 2:32; 86; 87] (based on his published uncertainty estimates [88; 89] and conference abstract [48]). The U.S. Global Change Research Program makes much the same point [90, Appendix A on pages 432 - 433], as does the climate scientist Andrew Dessler [91].
Furthermore, short-term warming events such as El Niño warm the bulk troposphere more than the surface, via a mechanism discussed in "Myth: The Tropospheric Hot Spot is a Fingerprint of CO2-induced Warming". Thus, if an El Niño occurs near the beginning of a trend, it would skew the lower tropospheric trend downwards moreso than the surface trend, exacerbating El Niño's misleading skewing of trends that I discussed in response to objection 2. This may explain why those ideologically-committed to showing as little global warming as possible, select lower tropospheric warming trends beginning on or soon before El Niño years such as 1997/1998 and 2002 [ex: 86]. They may also select satellite-based bulk tropospheric estimates because these under-estimate recent warming [ex: 377].
The current RSS and UAH analyses under-estimate lower tropospheric warming, as admitted by the RSS team [35, page S17; 47, page 7715; 48] and shown by comparisons to other data sources [35, page S17; 46, figure 10; 48; also see: 1077 and 1096 (with 1078 - 1084, generated using 152, as per 153)]. The current UAH analysis under-estimates warming to a larger extent than the current RSS analysis [35, page S17; 46, figure 10; 48; also see: 1077 and 1096 (with 1078 - 1084, generated using 152, as per 153)], especially after UAH recently adjusted their analysis in a way that reduced their warming trend over the past couple of decades [92, figure 7], consistent with the following:
- UAH has a long history of under-estimating tropospheric warming due to UAH's data adjustment methods [84; 91; 122, from 36:31 to 37:10; 132; 134, pages 5 and 6; 135 - 139; 141 - 143; 1102, from 15:23 to 24:00].
- Other scientists have critiqued UAH's adjustment methods [84; 91; 123; 124, pages 17 - 19; 125 - 132; 135 - 139; 141 - 143; 146; 1102, from 15:23 to 24:00].
- UAH's satellite-based temperature analyses often diverge from analyses made by other research groups, in both the mid- to upper troposphere and other atmospheric layers [35, pages S17 and S18; 84; 123; 124, pages 17 - 19; 125 - 133; 135; 140, pages S17 and S18; 141 - 145; also see: 1077 and 1096 (with 1078 - 1084, generated using 152, as per 153); 1102, from 15:23 to 24:00].
I discuss these issues more in section 2.3 of "Myth: Santer et al. Show that Climate Models are Very Flawed". But I will give one example below to illustrate the UAH team's long history of distortions.
Satellite-based tropospheric analyses require a diurnal drift correction to account for the fact that satellite measurements occur at different times of day [47; 91; 127; 130; 135; 136; 330]. Since temperature at noon will likely be warmer than temperature at midnight, correcting for this time-of-day effect remains crucial for discovering any underlying tropospheric warming trends. The RSS team revealed that UAH bungled the diurnal drift adjustment in a way that spuriously reduced UAH's tropospheric warming trend [91; 135; 136]. According to UAH team members Roy Spencer and John Christy, correcting the UAH team's error increased UAH's lower tropospheric warming trend by ~40% [136]. RSS' own warming trend was even larger than this [135].
The UAH team's distortion occurred because the UAH team falsely assumed that the lower troposphere warmed at midnight and cooled at mid-day [136]. When Christy admitted this error, RSS members Carl Mears and Frank Wentz offered the following priceless reply [136; 331] (highlighting added):


Or as reportedly noted by Kevin Trenberth, one of Christy's supervisors in graduate school:
"[Trenberth] said he distanced himself from Christy around 2001, worried that every time a decision was called for in processing data, Christy was choosing values that gave little or no trend [888]."
(This quote is consistent with Trenberth's decades-long history of documenting Christy's distortions and correcting those who abused Christy's distortions in order to misleadingly minimize global warming [138; 139; 901 - 903])
So the UAH team under-estimated warming. RSS has done so as well [47; 130; 377], though their errors were not as obvious or egregious as UAH's. Figure 9 below depicts UAH's and RSS' lower tropospheric temperature trend for their current analyses, in comparison to other data sources, revealing how RSS and UAH likely under-estimate warming over the past two decades (the period of time central to Curry's forecasts from section 2.1):
 |
| Figure 9: Global lower tropospheric relative temperature up to 2018, as estimated by various re-analyses that include data from diverse sources, radiosonde-based (weather-balloon-based) analyses, and satellite-based analyses. The colored lines indicate temperature relative to a baseline of 1981 - 2010 [35, figure 2.6 on page S17]. The satellite-based analyses likely under-estimate lower tropospheric warming [35, table 2.3 on page S18; 46, figure 10] over the past two decades, as admitted by the RSS satellite-based team [35, page S17; 47, page 7715; 48]. I discuss this further in section 2.2 of "Myth: Evidence Supports Curry's Claims Regarding Satellite-based Analyses and the Hot Spot". ERA5 is the update to ERA-I [35, pages S18 - S19; 178 - 182; 1166]; ERA-I under-estimates middle and lower tropospheric warming, as admitted by the ERA-I team [62, section 9; 381] and other researchers [382, section 2]. |
Myth proponents could hardly object to this comparison, since even UAH's Roy Spencer recommends comparing satellite-based analyses to the other sources shown in figure 9, in order to see whether satellite-based analyses under-estimate warming [610; 884]. Such a comparison shows the UAH analysis to be the low outlier for both the post-1979 period [35, table 2.3 on page S18; 46, figure 10] and the past couple of decades [35, figure 2.6 on page S17; 48; also see: 1077 and 1096 (with 1078 - 1084, generated using 152, as per 153)]. So Curry is wrong when she says these satellite-based, bulk tropospheric analyses are the best data we have [85, from 4:30 to 4:36; 176], especially in light of:
- UAH's aforementioned history of dubious temperature analyses
- RSS admitting [35, page S17; 47, page 7715; 48] to under-estimating lower tropospheric warming [35, page S17; 46, figure 10; 48; also see: 1077 and 1096 (with 1078 - 1084, generated using 152, as per 153)]
- RSS' Mears [85, from 1:37 to 2:32; 86; 87] and others [90, Appendix A on pages 432 - 433; 91] admitting these satellite-based analyses remain more uncertain than surface trends
- the satellite-based analyses conflicting with other data sources [35, page S17; 46, figure 10; 48; also see: 1077 and 1096 (with 1078 - 1084, generated using 152, as per 153)], as per figure 9
Despite these points, it would still be worthwhile to examine RSS' and UAH's trends, since Curry cites these satellite-based analyses [13; 18; 85, from 4:30 to 4:36; 176; 247] as the best data we have [85, from 4:30 to 4:36; 176] and the strongest evidence in support of a significant hiatus [18]. If her best data [85, from 4:30 to 4:36; 176] and strongest evidence [18] contradicts her, then that is a very bad sign for her position.
The 1997 - 2019 satellite-based, lower tropospheric warming trends are (in °C/decade):
- RSSv4 [47] : 0.19 +/- 0.14 [76 - 78]
- UAHv6 [92] : 0.11 +/- 0.14 [76; 79]
- Average : 0.15 [76 - 79]
The 1998 - 2019 trends are (in °C/decade):
- RSSv4 [47] : 0.18 +/- 0.15 [76 - 78]
- UAHv6 [92] : 0.10 +/- 0.15 [76; 79]
- Average : 0.14 [76 - 79]
- RSSv4 [47] : 0.22 +/- 0.15 [76 - 78]
- UAHv6 [92] : 0.15 +/- 0.15 [76; 79]
- Average : 0.19 [76 - 79]
- RSSv4 [47] : 0.19 +/- 0.18 [76 - 78]
- UAHv6 [92] : 0.15 +/- 0.18 [76; 79]
- Average : 0.17 [76 - 79]
So despite the RSS team admitting to under-estimating recent warming [35, page S17; 47, page 7715; 48], their analysis contradicts post-1998-flat [2; 8; 13] and post-2002-cooling [2; 3]. It also conflicts with continuing-hiatus [5; 9; 14; 57; 1188] and continuing-pause [4; 9], despite Curry's claims to the contrary [13; 18; 247]. A comparison to IPCC-wrong would again not be apt, since the IPCC projections Curry discusses [7; 18; 97; 98; 677] were for surface trends [45, page 1010 and figure 11.25b on page 1011; 159, page 7; 160, page 763; 836, section 3.2 on page 45], while RSS and UAH are bulk troposphere analyses, not surface analyses [35, pages S17 and S18; 47; 135]. And even if one takes the average of UAH and RSS, in accordance with the recommendation of UAH's John Christy [154; 155], then that average still undermines post-1998-flat [2; 8; 13], continuing-hiatus [5; 9; 14; 57; 1188], and post-2002-cooling [2; 3], while supporting continuing-pause [4; 9]. This despite the aforementioned fact that UAH greatly under-estimates warming [35, page S17; 46, figure 10; 47, page 7715; 48] (see figure 9) and has a decades-long history of doing so [84; 91; 122, from 36:31 to 37:10; 132; 134, pages 5 and 6; 135 - 139; 141 - 143; 1102, from 15:23 to 24:00], along with Curry's cherry-picked post-1998 and post-2002 time-frames beginning on warm El Niño years [94; 95; 332; 336 and 701, generated using 152, as per 153] that misleadingly skew the temperature trends low, as per the mechanism discussed in "Myth: The Tropospheric Hot Spot is a Fingerprint of CO2-induced Warming".
Another type of satellite-based analysis also undermines Curry's position: global positioning system radio occultation (GPS RO), which shows post-2002 upper tropospheric warming [338, figure 4; 344]. GPS differs [338; 339, section 2.3; 340 - 343] from the microwave-emissions-based methodology used by RSS and UAH [35, pages S17 and S18; 47; 84; 135], allowing scientists to use GPS RO to validate microwave-emissions-based results, or vice versa [338; 339, section 2.3; 340 - 343]. Thus, even the satellite-based analyses generally undercut Curry's position, despite her citation of them as supporting her position [13; 18; 247]. And continuing-pause, the only claim of her's that the satellite-based analyses might support, involves Curry abusing English to claim that a large rate of warming (in the context of the past 2000 years) is actually as a pause in warming, as per section 2.1.
Objection 4: More time should pass before one assesses Curry's claims [1035]. For instance, she made some claims extending to the 2030s [4; 9; 14; 57; 1182, with 1180], said to wait until about 2021 to assess whether the pause/hiatus is really over [13; 863], and introduced further pre-conditions before she would assess post-1997 temperature trends [861; 863].
(Note: When 2021 arrived and Curry was pointed to evidence of global warming accelerating as opposed to a 21st century "hiatus" continuing, Curry moved the goalposts by saying more time needed to pass before one could assess the temperature trend [1175; 1176]. So Curry's plea to wait until 2021 was made in bad faith. The response below was written before this 2021 instance of Curry's dishonesty.)
Response 4: Stalling until 2021 will not help Curry, especially since 2020 will almost certainly remain at post-2015 elevated temperature levels [675; 864 - 866; 876; 973; 974; 1138; 1150; 1162; 1163]; this became clear even by the end of January 2020 [675; 864 - 866; 876]. And Curry's own words undercut the aforementioned objection. For example, Curry endorsed [2; 3] Anastasios Tsonis' claims on climate shifts [190, page 4; 191, paragraphs 14 and 15; 192 - 194] bringing an end to warming. Tsonis' views on climate shifts led him to say in 2013 that, "[t]here is no doubt the warming of the 1980s and 1990s has stopped [192; 426; 427]." So if a source [192] Curry endorsed [2; 3] focused on temperature trends across two decades in the 1980s and 1990s, it would be special pleading for Curry and her defenders to complain about section 2.1 examining temperature trends across two decades in the 2000s and 2010s.
It would also be special pleading for Curry to complain, since she previously used short time-frames of less than 18 years to object to the IPCC's projections [7; 18; 98; 677]. After all, she began making claims on a supposed post-1997 pause in 2011, using 13 full years of data (beginning of 1998 to end of 2010) [2; 97; 670; 680]. Furthermore, she used a 2000 - 2019 time-period to criticize projections [840] of warming-related phenomena [253; 255 - 259], such as sea level rise. She even explicitly focused on IPCC projections for the first two decades of the 21st century, as per of her IPCC-wrong forecast [211; 677]. The first two decades of the 21st century are over (beginning of 2000 to the end of 2019), so this leaves no further time for Curry to move the goalposts to avoid admitting her IPCC-wrong forecast failed. Using objection 4 to defend Curry therefore contradicts Curry's words, and involves an untenable double-standard in which Curry's short-term frames are fine, but section 2.1's longer time-frames are too short.
Curry herself moved the goalposts to assessing her claims in 2021 [13; 863], and then to not assessing her forecasts until warm Pacific decadal variability from 2015 dissipated [861; 863]. Her variability point is a blatant evasion since:
Curry herself moved the goalposts to assessing her claims in 2021 [13; 863], and then to not assessing her forecasts until warm Pacific decadal variability from 2015 dissipated [861; 863]. Her variability point is a blatant evasion since:
- the same issues from my response to objection 2 apply, including that a strong Pacific-variability-independent warming trend remains, and that Curry conflates questions about detecting a warming trend with questions about attributing causes to that trend
- Curry exploited Pacific variability to claim a pause/hiatus, by starting her trends [2; 3; 7; 13; 18; 98] on (or soon before) warm El Niño years [94; 95; 332; 336 and 701, generated using 152, as per 153] and ending them [2 - 5; 7; 10; 57; 97; 98; 314] on (or soon after) cool La Niña years [94; 95; 332; 336 and 701, generated using 152, as per 153]; if Curry felt that variability did not prevent her from evaluating those trends, then that variability should not stop her from evaluating trends now, unless she engages in special pleading / an ad hoc double-standard
- Pacific variability such as El Niño does not account for the post-1997 warming trends from section 2.1, as per my response to objection 2, figure 8, and "Myth: El Niño Caused Post-1997 Global Warming"; a substantial warming trend still remains after accounting for internal variability
- El Niño [94; 95; 332; 336 and 701, generated using 152, as per 153] and Pacific Decadal Oscillation [1036 and 1037, generated using 152, as per 153; 1041 - 1043] conditions are not in the strong warm phase that they were in during Curry's [7; 18; 98; 677, with 972] cherry-picked 1997/1998 start-point (see figure 7); Interdecadal Pacific Oscillation conditions are also not higher now than in 1997/1998 [752, figure 1; 1038 - 1040]
- her chosen method of accounting for variability by drawing a straight line from the ~1998 El Niño and ~2016 El Niño [232, page 40; 316], still results in a warming trend large enough [928 - 930, generated using 152, as per 153; 931; 951, with 950] to debunk her forecasts, as per my response to objection 5
So Curry's own use of objection 4 [13; 861; 863] exposes the internal inconsistency in her reasoning; she again remains committed to willfully ignoring evidence against her forecasts, as discussed in section 2.1.
To make matters worse for objection 4, Curry previously complained about supposed "climate model apostles [4]" increasing the length of time a pause must extend before it became a problem for climate models. In particular, Curry discussed the time period being increased from 10 years to 15 years, and then to 17 years [4], possibly in reference to a paper co-authored by the climate scientist Ben Santer [93; 97; 314, page 3]. She then claimed a pause is particularly significant if it exceeds 17 years [18] and that a pause of longer than 20 years would firmly imply a problem with climate models [5]. Thus if Curry emphasized time periods of over 17 years [4; 97; 314, page 3], then her defenders could hardly complain about section 2.1 examining trends of 18, 20, 22, and 23 years (beginning of 2002 - end of 2019, 2000 - 2019, 1998 - 2019, and 1997 - 2019, respectively). And one could use her own words to accuse the "Judith Curry apostles" of unjustifiably increasing the length of time warming must extend before it became a problem for Curry's claims.
An 18- or 22-year period already shows that many of Curry's claims lack merit, such as 2018-not-top-five and continuing-hiatus. One cannot make those claims true by saying some of Curry's claims for the more distant future might turn out to be true. Moreover, one need not, and should not, oblige Curry's attempts to move the goalposts [13; 14; 247; 414; 497; 861; 863; 1175; 1176] on the assessment of her forecasts. For instance, a statistical analysis of whether there was a post-1998 or post-2002 hiatus, need not wait until 2021 just because Curry requests [13; 863] that wait-period. Such an analysis would show that Curry remains guilty of not waiting long enough on her trends, since she engaged in end-point bias.
So Curry commits a mistake akin to thinking that those recent 4 coin flips reverse the long-term, 50-flip trend of 1:1 ratio of head-to-tails, and thus those 4 recent flips constitute a significant pause/hiatus in that 1:1 ratio. One can perform statistical tests to prevent this mistake. When scientists perform such testing, they find no statistically significant post-1998 hiatus [65; 66; 75; 104; 105; 107 - 112; 116; 117; 118, pages 145 and 150; 119]. To put the point another way: there is no change-point in the global surface warming trend after 1980 [66; 104; 107 - 111; 116; 117; 118, pages 145 and 150; 119], contrary to what Curry claimed [98], and warming continued [61; 62, section 4; 63; 65; 66 71; 75; 104 - 108; 113 - 117; 118, pages 145 and 150; 174; 1052], as per "Myth: No Global Warming for Two Decades". Curry therefore waited for too short a time before declaring a significant pause/hiatus.
It is quite telling that Curry engaged in such end-point bias, since NASA [449; 450], the NOAA [844], the U.S. Global Change Research Program [942], and the IPCC [229, page 162] offer introductory-level explanations on the dangers of using short-term fluctuations to falsely claim longer-term warming stopped. And in 2014, Bart Verheggen warned Curry of the risk of cherry-picking short time-periods when it came to human-made greenhouse-gas-induced warming [1139]. Figure 8 illustrates the perils of Curry's cherry-picking, as a greenhouse-gas-induced warming effect builds up more on multi-decadal time-scales. So proponents of objection 4 should state that Curry ought to have waited longer before making her false claims, not that others should wait longer before assessing her claims. 18 to 23 year time-frames are long enough to yield statistically significant warming trends that rebut Curry's forecasts, as per section 2.1.
Objection 5: Elsewhere Curry endorsed a forecast consistent with continued global warming [40], and her forecast overlapped with those of the IPCC [45, figure 11.25b on page 1011]. Section 2.1 cherry-picks to avoid this forecast.
Response 5: Figure 11's red hashing below depicts the Curry forecast in question, in comparison to the IPCC's projection in figure 10's red hashing:
 |
Figure 10: Modified version [41] of the IPCC's 2013 model-based forecast [45, figure 11.25b on page 1011]. The figure is modified to include observational datasets up to 2018. The gray shading represents the range of of values from climate models in the Coupled Model Intercomparison Project Phase 5 (CMIP-5), under difference greenhouse gas emissions scenarios (RCPs, also known as Representative Concentration Pathways). The gray shading excludes the lowest 5% of values and the highest 5% of values, while the thick gray lines represent the minimum and maximum value of all the model projections. The model-based projections are relative to 1986-2005 for the light gray shading, and to 2006 - 2012 for the dark gray shading. The area to the left of the vertical dashed line use historical estimates of greenhouse gas levels, right the area to the right uses values from the RCPs. For more on why these model-based projected trends do not conflict observational analyses, see sections 2.1 and 2.2 of "Myth: Santer et al. Show that Climate Models are Very Flawed". The red hashed area represents the IPCC's assessed range for "likely" values for 2016 - 2035 [41], where "likely" means 66% chance or more [45, page 955]. The black bar depicts the assessed 2016-2035 average. The thin gray lines show the range of uncertainty for the HadCRUT4 analysis. The other observational datasets are Cowtan+Way, NASA's GISTEMP, NOAA's global analysis, and Berkeley Earth's surface temperature analysis. The observational analyses are relative to a baseline of 1986 - 2005, as per the y-axis on the left side, while the y-axis on the right depicts those trends as relative to the 1850 - 1900 [41]. Other sources note that HadCRUT4 tends to under-estimate recent warming due to its poorer global coverage [52; 61; 62, section 4; 63, figure 1, sections 4.2.2 and 4.2.3; 64 - 74; 378, page 57; 380; 402, cited by 412; 608, section 2b on page 4681], especially [52; 61 - 74; 378, page 57; 380; 402] in the rapidly warming [52; 65; 177; 390; 403, figure 2; 404 - 406; 1024; 1085; 1086] Arctic. This figure comes from Climate Lab Book [41], a website operated by the climate scientist Ed Hawkins [42; 43]. Hawkins co-authored the IPCC's original version of this figure and also co-authored the chapter of the IPCC report in which this original figure appeared [44; 45, page 953]. |
 |
Figure 11: Temperature forecast endorsed by Judith Curry in November 2015, and provided by the climate scientist Ed Hawkins [40] as a modification of the IPCC's 2013 model-based forecast [45, figure 11.25b on page 1011]. The gray shading represents the range of of values from climate models in the Coupled Model Intercomparison Project Phase 5 (CMIP-5), under difference greenhouse gas concentration scenarios (RCPs, also known as Representative Concentration Pathways). The gray shading excludes the lowest 5% of values and the highest 5% of values, while the thick gray lines represent the minimum and maximum value of all the model projections. The model-based projections are relative to 1986-2005 for the light gray shading, and to 2006 - 2012 for the dark gray shading. The area to the left of the vertical dashed line use historical estimates of greenhouse gas levels, right the area to the right uses values from the RCPs. The red hashed area represents Curry's assessed range for "likely" values for 2016 - 2035 [40, with 1051]. The thin gray lines show the range of uncertainty for the HadCRUT4 analysis. The other observational datasets are Cowtan+Way, NASA's GISTEMP, NOAA's global analysis, and Berkeley Earth's surface temperature analysis. The observational analyses are relative to a baseline of 1986 - 2005, as per the y-axis on the left side [40]. Other sources note that HadCRUT4 tends to under-estimate recent warming due to its poorer global coverage [52; 61; 62, section 4; 63, figure 1, sections 4.2.2 and 4.2.3; 64 - 74; 378, page 57; 380; 402, cited by 412; 608, section 2b on page 4681], especially [52; 61 - 74; 378, page 57; 380; 402] in the rapidly warming [52; 65; 177; 390; 403, figure 2; 404 - 406; 1024; 1085; 1086] Arctic. The author of this figure, the climate scientist Ed Hawkins [40], also co-authored the IPCC's original version of this figure and co-authored the chapter of the IPCC report in which this original figure appeared [44; 45, page 953]. |
Moving on from Curry's distortion of figure 10: Curry endorsed figure 11's forecast in November 2015 [40], in the midst of a warm El Niño year (see figure 7). So she likely accepted this forecast to get ahead of this warming. This becomes even more apparent when one recognizes that figure 11 conflicts with Curry's earlier predictions from section 2.1 and supplementary section 2.2. For example, Curry claimed it would be surprising if warming up to 2025 occurred at the rate projected by the IPCC [8; 98], as per IPCC-wrong. Yet that contradicts figures 10 and 11, since up to 2025, Curry's red hashed area in figure 11 greatly overlaps with the IPCC's red hashed area in figure 10 [40 (with 1051); 45, figure 11.25b on page 1011 and 151]. And Curry's red hashing in figure 11 struggles to accommodate her post-2002-cooling forecast [3] that she offered in support of Tsonis' cooling forecast [192 - 194], not to mention to her previous endorsement of Tsonis' temperature trend predictions [2; 3].
So Curry's acceptance of figure 11 seems to be a blatant attempt to move the goalposts from her other forecasts in section 2.1, without admitting her error with respect to these forecasts. Consistent with this interpretation, in 2020 Curry shifted to making projections for 2020 - 2050, while making sure not to evaluate her predictions for the 1998 - 2019 period [855 - 858; 863]. She claimed her new projections encompassed the range of "plausible" scenarios, ranging from 0.5°C of cooling to 0.7°C of warming [855 - 857]. That "plausible" range includes the ~0.2°C/decade IPCC forecast [45, page 1010; 159, page 7; 836, section 3.2 on page 45] she previously objected to [7; 8; 18; 98] (0.7°C / 31 years, for 2020 - 2050 [855 - 857]). Curry thus remains poised to brazenly claim she was right if ~0.2°C/decade of warming continues, without ever admitting that trend debunks her previous position.
Objection 6: The IPCC's 2013 Fifth Assessment Report said there was a hiatus in warming [229, page 162; 379, pages 769 - 772], just as Curry did [5; 9; 14; 57; 1140; 1188], undermining climate models that did not predict a hiatus. So one could hardly claim the IPCC was right, while Curry was wrong [668; 705].
Response 6: Objection 6 will need to address the contradiction in Curry claiming that IPCC forgot to mention the pause/hiatus [678], when she later tried to defend her pause/hiatus claims by stating the IPCC discussed the pause/hiatus [668; 705]. The IPCC's 2013 Report does discuss a hiatus in global surface warming from 1998 - 2012 [229, page 162; 379, pages 769 - 772]. But while doing this, the IPCC makes many of the same points discussed in this blogpost. For example, they note that the warm 1998 El Niño skews the temperature trend for the short time-period from 1998 - 2012, as per section 2.1 and my response to objection 2. So natural variability caused this shorter trend to not be representative of the longer-term warming trend [229, page 162]. Moreover, the IPCC discussed a number of explanations for this shorter trend, including explanations that did not imply an error in the climate models [379, pages 769 - 772]; I discuss this more in section 2.1 of "Myth: Santer et al. Show that Climate Models are Very Flawed". So objection 6 errs in using the IPCC's report to cast doubt on model-based projections on longer-term warming.
Nor should one present the IPCC as agreeing with Curry. After all, Curry's IPCC-wrong forecast conflict with what the IPCC says; that is the whole point of that forecast. Her forecasts on exaggerated global warming formed one of the central pillars of her critique of the IPCC [7; 8; 10; 18; 54; 55; 98; 672; 1112; 1185]. Moreover, the IPCC's 2013 Report predicted future warming [45, page 1010] even while discussing a "hiatus" [379, pages 769 - 772], as per figure 10 above and in contrast to Curry's forecasts, such as post-1998-flat and post-2002-cooling. And the IPCC's forecasted warming occurred, as per section 2.1. Objection 6 attempts to evade this point by selecting a 2013 IPCC Report that does not include post-2012 warming. In contrast, the IPCC's 2018 Special Report includes post-2012 warming, showing that human-made global warming continued at a rate of ~0.2°C/decade, in accordance with climate models [378, pages 4 and 57 - 59] and in contradiction to Curry's section 2.1 predictions of IPCC-wrong, post-2002-cooling, post-1998-flat, continuing-hiatus, and continuing-pause. Objection 6 therefore again fails in its attempt to use the IPCC's work to defend Curry and to undermine model-based temperature trend projections.
Nor should one present the IPCC as agreeing with Curry. After all, Curry's IPCC-wrong forecast conflict with what the IPCC says; that is the whole point of that forecast. Her forecasts on exaggerated global warming formed one of the central pillars of her critique of the IPCC [7; 8; 10; 18; 54; 55; 98; 672; 1112; 1185]. Moreover, the IPCC's 2013 Report predicted future warming [45, page 1010] even while discussing a "hiatus" [379, pages 769 - 772], as per figure 10 above and in contrast to Curry's forecasts, such as post-1998-flat and post-2002-cooling. And the IPCC's forecasted warming occurred, as per section 2.1. Objection 6 attempts to evade this point by selecting a 2013 IPCC Report that does not include post-2012 warming. In contrast, the IPCC's 2018 Special Report includes post-2012 warming, showing that human-made global warming continued at a rate of ~0.2°C/decade, in accordance with climate models [378, pages 4 and 57 - 59] and in contradiction to Curry's section 2.1 predictions of IPCC-wrong, post-2002-cooling, post-1998-flat, continuing-hiatus, and continuing-pause. Objection 6 therefore again fails in its attempt to use the IPCC's work to defend Curry and to undermine model-based temperature trend projections.
Response 7: Curry's forecasts constitute a significant portion of her position. She offered them for the better part of a decade, as shown in supplementary section 2.2, and she peddled similar claims to the United States Congress [19; 313; 314, pages 3 - 4]; her pause/hiatus claims once formed a large part of what she says was the "best summar[y] [233]" of her views on climate change, as mentioned in section 2.1. In 2012 she even said the pause/hiatus was "the heart of the recent scientific debate on climate change [1148]". And she followed that up in 2013 by saying that the pause was "the most important issue in the public debate on climate science, for well over a year now [678]". She also used her pause/hiatus forecasts to criticize the IPCC [7; 10; 54; 55; 98] in outlandish ways, some of which were also shown in section 2.1. Thus the failure of her forecasts, in comparison to the better accuracy of the IPCC's forecasts, undermines her central critique of the IPCC [7; 8; 10; 18; 54; 55; 98; 672; 1112; 1185], undermines her claims to Congress, and rebuts her position on a topic she claimed was important.
The inaccuracy of Curry's forecasts also undercuts much of her peer-reviewed work and the work she cites. For example, Curry stated [5; 9; 57; 250; 417] that her stadium wave hypothesis [183 - 189; 1158; 1159], which she co-authored with Tsonis [184; 186], implied continued-hiatus. She also endorsed [2; 3] Tsonis' [190, page 4; 191, paragraphs 14 and 15; 192 - 194; 426; 427] debunked prediction of a climate shift causing an end to warming, as per post-2002-cooling. Curry further claimed that an undergoing pause/hiatus in global warming would occur as a result of ocean cycles, and as a result of the fact that global temperature is not very sensitive to changes in the level of greenhouse gases such as carbon dioxide (i.e. climate sensitivity to CO2 is low) [5; 7; 14; 57; 98]. Continued warming, in contradiction to Curry's predictions [2; 3; 5; 8; 9; 13; 14; 57], thus lends credence to the idea that Curry under-estimated how much CO2-induced warming would occur, and thus she under-estimated climate sensitivity (for more on Curry's history of under-estimating climate sensitivity, see section 2.5 of "Myth: Attributing Warming to CO2 Involves the Fallaciously Inferring Causation from a Mere Correlation"). Her reasoning would have failed anyway, since shorter-term temperature trends from variable factors does not imply lower climate sensitivity [1088 - 1093].
Curry's failure on surface warming further ties into her claims on sea level rise projections [56; 164 - 166; 232, section 5; 263] (claims I addressed outside this blog [164 - 166]), since surface warming contributes to sea level rise by melting land ice and causing thermal expansion of water [253; 255 - 259]. This contributes to a correlation between sea level and changes in CO2 concentration on longer time-scales [251, figure 12; 252 - 254], as per CO2-induced warming, and consistent with warming-induced, human-made sea level rise during the industrial-era [264 - 273]. A similar point applies to Curry's claims on hurricanes [234; 235; 315 - 320], given the expected relationship between surface warming vs. increased hurricane intensity [288; 290; 292; 294 - 298] and decreased hurricane frequency [150, page 2290; 287 - 293]. And the pointed extends to her claims on ice melt [20; 250; 260 - 263], along with wildfires [418; 419], since human-made greenhouse-gas-induced warming caused ice melt [274 - 286] and affects the risk of wildfires [420 - 425; 477]. Thus Curry's inaccurate surface temperature trend forecasts undermine multiple important aspects of her position.
In fact, Curry remains even more tied to her forecasts than your typical academic scientist. In contrast to many other scientists, Curry left academia early [299; 300]; she did so in order to run her company Climate Forecast Applications Network (CFAN) [2; 233; 299; 300]. She claims the company is in the business of making predictions and that their predictions are good [2]. Curry makes forecasts on behalf of this company [234 - 236; 495 - 497], along with writing reports for them on topics such as sea level rise [237], hurricanes [315; 418; 419], and wildfires [418; 419]. So the failure of Curry's forecasts reflects badly not only on her scientific position, but also on the credibility of the work she performed on behalf of her company. Curry is so bad at her forecasting job that it is probably better to rely on the IPCC, instead of her and her forecasting company, despite the IPCC's tendency to often under-estimate climate change trends [195, page 86; 196 - 210; 398, page 1-13 in section 1.4] (as the IPCC itself acknowledges [398, page 1-13 in section 1.4], among others [1123, updated in 817 and 1124]) and the IPCC's tendency to use non-alarmist, conservative language that acknowledges when uncertainty is present [357 - 361; 385].
Objection 8: Curry's failed 2018-not-top-five forecast is not pertinent to her longer-term claims. So section 2.1 should not have covered that forecast.
Response 8: 2018-not-top-five actually fits naturally in with Curry's longer-term claims. To see why, note that for 2018 to fall out of the top-five, rapid post-2016 cooling would need to bring 2018 to below 2014. That drop would need to happen in order for 2018 to fall to near 1998 levels [162; 321 - 324], in accordance with Curry's post-1998-flat forecast. She even explicitly linked post-2016 cooling to her position on a pause [13]. If that cooling occurred, then presumably Curry might then try to write off the 2014 - 2017 warming as a short blip on the way to climate returning to the post-1998-flat trend. Of course, this was not to be, so Curry's 2018-not-top-five forecast collapsed, as did post-1998-flat.
Objection 9: Curry readily admitted to the failure of 2018-not-top-five [33]. So she is clearly capable of admitting she is wrong. Yet she has yet to admit to the failure of post-1998-flat, post-2002-cooling, continuing-hiatus, continuing-pause, and IPCC-wrong. Instead she insists the hiatus continues [14; 247] and that her predictions can be assessed in the future [13; 14; 247; 414; 497; 861; 863; 1175; 1176], as per objection 4. So why would she not admit she was wrong on these forecasts, when she previously admitted to a different mistake? It is more likely that she knows what she is talking about as an expert, while her non-expert critics do not.
Response 9: At first glance, this objection seems to carry some weight. After all, Curry is a climate scientist, while I am not. Moreover, my blog is not peer-reviewed, and peer review tends to help limit errors in a scientific analysis [354; 483, page 244; 484, page 712; 485]. However, despite these points, objection 9 still fails. The objection incorrectly frames this as a debate between the climate expert Judith Curry, vs. a non-expert like me writing on a non-peer-reviewed blog. In reality, this is a debate between claims Curry posted on her blog [2 - 5; 7 - 10; 13; 32; 54; 55; 57] and other non-peer-reviewed venues [14; 19; 313; 314, pages 3 - 4], vs.:
- numerous climate scientists working together to publish peer-reviewed [827 - 834; 1102, from 22:00 to 22:32] IPCC assessments and projections [45; 159; 160; 378; 836] (though the paranoid contrarian [1103; 1104; 1105, pages 43 and 58] John Christy casts false doubt on the IPCC's peer review process by conveniently leaving out [1106] the role of review editors [827, pages 7 - 8; 828, section 3; 830, page 1185; 832; 833; 1102, from 22:00 to 22:32; 1107; 1108])
- the temperature trends from peer-reviewed sources I cited
- other experts who criticized Curry's claims [183; 187; 242; 360; 372; 487 - 494; 553 - 555; 953 - 955; 961; 975; 976; 1044, page 1148; 1046 - 1049; 1053, citing 1054 and 1055; 1094; 1095; 1129]; Curry herself admits that she struggles to explain why so many scientists disagree with her [486; 1157]
And so on.
This leaves objection 9's question of why Curry avoids admitting her predictions were wrong. One possible rationale is political/ideological: Curry uses her claims on temperature trends to downplay human-made climate change [5; 7; 14; 57; 98; 497; 498 (with 383); 499; 1154 (with: 1155; 1156); 1157; 1160 (with 1161)] and to argue against various climate-related policies/regulations [7; 498 (with 383); 508; 556; 557; 707 - 710; 730; 1128, page 123]. This is not surprising, since she leans libertarian [486] and receives financial support from the fossil fuel / energy industries [372 (cited by 501 and 502); 602; 616; 617], though she may hold to her contrarian position for other reasons. Curry also employs a number of other tactics to make her case, some of which were covered in section 2.1. These tactics include:
- exaggerating uncertainty or manufacturing false doubt about the science [360; 506; 507]
- inaccurately comparing mainstream scientists and the science she does not accept to a religion [4; 12; 503] that persecutes others [505]
- relying on industry-funded fake experts, who's views conflict with a wealth of evidence [509]
- falsely insinuating that mainstream scientists take the scientific position they do in order to keep their jobs or government/grant funding [11; 12; 96] (see figure 5, for example)
- obscuring or downplaying the evidence-based scientific consensus [503 - 505; 507; 557]
The tobacco industry, anti-vaxxers / vaccine denialists, and other science denialists used similar tactics [195; 346 - 351; 354; 355; 483 - 485; 510 - 528; 1152] to avoid policies/regulations they disliked, as per section 2.1 and supplementary section 2.4 of "Myth: Science Denialism is as Rampant Among Liberals as Among Conservatives". Curry has a ready-made audience for her abuse of these tactics, since many political conservatives/libertarians wish to avoid certain environmental policies and regulations [528, from 10:52 to 21:42; 529; 530, page 1; 532 - 538; 674], and thus they seek to avoid accepting climate change evidence that might be used to justify such policies. This results in a negative correlation in the United States between political conservatism vs. trusting climate scientists and accepting various scientific claims regarding climatology [478 - 480; 529; 531; 534; 539 - 549; 558; 674].
So as noted in section 2.1, a number of conservatives cite Curry to manufacture false doubt and exaggerate uncertainty about climate science, in order to avoid science being used to support environmental policies they dislike [369; 373 - 375]. Curry would not be as useful to these individuals if she admitted she made inaccurate forecasts that under-estimated the magnitude of global warming; by admitting to the failure of her forecasts, she would thereby undermine the ideological narrative she peddled to this conservative/libertarian audience. Panels g and i in figure 12 below illustrate the political divide Curry exploited when she used her failed forecasts to claim global warming flattened [2; 8; 13] / stopped [670; 680] / paused [4; 9] / underwent a hiatus [5; 9; 14; 57; 1188]:
So as noted in section 2.1, a number of conservatives cite Curry to manufacture false doubt and exaggerate uncertainty about climate science, in order to avoid science being used to support environmental policies they dislike [369; 373 - 375]. Curry would not be as useful to these individuals if she admitted she made inaccurate forecasts that under-estimated the magnitude of global warming; by admitting to the failure of her forecasts, she would thereby undermine the ideological narrative she peddled to this conservative/libertarian audience. Panels g and i in figure 12 below illustrate the political divide Curry exploited when she used her failed forecasts to claim global warming flattened [2; 8; 13] / stopped [670; 680] / paused [4; 9] / underwent a hiatus [5; 9; 14; 57; 1188]:
 |
Figure 12: Results of a 2014 survey on the relationship between Americans' political identification vs. acceptance and perception of an evidence-based scientific consensus. The x-axis measures partisan identification from strongly Republican (Strong R) to strongly Democratic (Strong D). Light gray shading represents the 95% confidence interval [478, figure 2 on page 12]. The queries for each of the panels were as follows: (g) that humans have been causing the Earth’s climate to warm in recent years; (h) that eating a genetically modified fruit could lead to a person’s own genes being modified; (i) that the Earth’s climate has been warming in recent years; (j) that the continents on which we live have been moving their locations for millions of years; and (k) that plants produce the oxygen that we breathe [478, table 1 on page 7]. The full version of this figure is here. The results for the dark, solid line in panel (i) are borne out by several others studies [479; 480; 545; 558; 674]; though American political conservatives were disproportionately more likely to not accept that Earth warmed [478, figure 2 on page 12; 480], overall the majority of Americans accepted that Earth warmed [480; 481, page 5]. One might object to panels (g) and (i) by saying that there is not an evidence-based scientific consensus that humans caused warming nor that Earth recently warmed. I rebut the former objection in "Myth: Attributing Warming to CO2 Involves the Fallaciously Inferring Causation from a Mere Correlation", and I debunk the latter objection in "Myth: No Global Warming for Two Decades". Scientists from 2015 and earlier acknowledged that Earth continued to warm [ex: 61; 75; 109 - 111; 114; 115; 174; 229, page 194; 482, "In Brief" on page 80]. |
Second, if Curry's predictions failed, then this would undermine the credibility of many of her scientific claims. After all, Curry's post-1998 and post-2002 forecasts remain intimately tied to many of her positions, ranging from her opposition to the IPCC [7; 8; 98], to her work [234 - 237; 315] with her forecasting company CFAN [2; 233; 299; 300], and her claims on the (supposed) stadium wave [5; 9; 57; 250; 417 (with: 183 - 189; 1158; 1159)], ocean cycles and climate sensitivity to changes CO2 [5; 7; 14; 57; 98], sea level rise [56; 164 - 166; 232, section 5; 263], ice melt [20; 250; 260 - 263], hurricanes [234; 235; 315 - 320], wildfires [418; 419], etc. Third, Curry has a financial incentive not to admit she is wrong. For example, she claims that criticism of her and her claims harmed her career, thereby closing Curry off from employment opportunities [1167 - 1172 (with: 886)]. It might harm her career and ego even more to admit those criticisms were true since her forecasts failed. Moreover, the fossil fuel / energy industries fund Curry [372 (cited by 501 and 502); 602; 616; 617], as do other CFAN clients. Curry states that many of her clients want accurate temperature trend forecasts for the 21st century [495 - 497], the very period of time in which Curry's temperature trend forecasts failed, as per section 2.1. So admitting her forecasts were wrong would likely harm her career decimate her credibility among informed people, including possible CFAN customers looking for someone to make accurate forecasts.
In contrast, acknowledging her erroneous 2018-not-top-five prediction would, at worst, moderately undermine the credibility of her short-term CFAN predictions. That helps explain why Curry quietly admitted that 2018-not-top-five failed once in a throw-away line on her blog [33], while not yet admitting to the failure of post-1998-flat, continuing-hiatus, post-2002-cooling, and IPCC-wrong. Moreover, she almost had no choice but to admit the the failure of 2018-not-top-five, since it was part of a list of prognostications she made at the beginning of 2018 [32] and which she committed to assessing at the end of 2018 [32; 33]. It would look too strange for her to assess the other predictions, while conveniently leaving out 2018-not-top-five. One might therefore suspect that even as Curry acknowledged that 2018-not-to-five failed, her CFAN job motivates her to not admit to the failure of her longer-term forecasts. That would be rather ironic, given how Curry unjustifiably accused IPCC scientists of exaggerating the effect of greenhouse gases [11] in order to keep their jobs [11; 12; 96]. Yet with the collapse of Curry's IPCC-wrong forecast, it was Curry, not the IPCC, who failed in their temperature trend forecasts.
Judith Curry reported confidence in the Berkeley Earth [303; 337] and HadCRUT instrumental analyses [303]; she formerly worked with Berkeley Earth on their analysis [333; 334; 337] and expressed pleasure in how it turned out [337]. And in her published work she cites trends from HadCRUT4 [550, section 3.3; 551, section 3c; 552]. Curry also lauds the use of re-analyses [16; 18 - 20; 681; 925; 927], including ECMWF's work with their re-analyses ERA5 and ERA-I [18; 20; 681; 925; 927], along with [20, citing 1032; 1034] CERA-20C from ECMWF's ERA-CLIM2 project, as discussed in section 2.1. The quotes below provide examples of this, both in terms of Curry's own claims and her endorsement of claims from the contrarian Ryan Maue. So feel free to take Curry's advice to "read what [she] write[s] [806]":
June 2015 (from Judith Curry):
"The surface temperature data sets that I have confidence in are the UK group and also Berkeley Earth [303]."
"Since 1979, we have global satellite coverage from a multitude of sensors that measure (in)directly many aspects of the climate system. Numerical weather prediction techniques like 4D-Var used by the best weather models (ECMWF, UKMET) produce an analysis of the atmosphere-ocean system every day incorporation so much data from many sources that imo it’s one of humanity’s remarkable achievements.
[...]
If I wanted to create a time series of global temperature since the 1990s, then I would [sic] NWP / variational techniques [15]."
"I agree with Ryan Maue that with regards to recent (post 1990’s) [sic], we should be looking at the reanalyses, which provides the basis for a dynamically and thermodynamically sensible ‘interpolation’ into the data sparse region of the Arctic [16]."
"In the 1990’s, we were cautioned not to use reanalyses for long term trends, owing to discontinuities in the satellite observing system. However, the situation has improved in recent decades and looking at trends during the most recent 20 years is reasonable.
Here is the figure on the global average surface temperature anomalies from the ECMWF reanalyses (ERAi) published by ECMWF earlier this year [...].
[...]
The main features from the conventional temperature analyses are barely recognizable in the CFSR – 1998 is barely a blip and 2014 is nothing close to a warmest year.
I am not sure what to make of the differences between ECMWF and CFSR. ECWMF has the most comprehensive and best data assimilation system in the world, so I am inclined to pay serious attention to their global surface temperature analysis. In any event, I would like to see much more attention paid to interpreting the reanalysis products in terms of recent global temperature trends [18]."
"Judy, thanks for highlighting the use of reanalysis datasets for global temperatures.
ECMWF uses 4-D variational data assimilation to optimally combine all sources of data include satellites, surface stations, balloons, aircraft, ships, etc.
A new reanalysis is being conducted called the ERA5 under the auspices of the ERA-CLIM2 project. This model will be coupled (atm+ocean) and provide the best estimate yet of the historical climate system from essentially the point of view of the best weather modeling system currently available [17]."
"And then there is the numerical weather prediction reanalysis data simulation systems that give us a global view, and we haven't been really using that for climate purposes, and I think we need to [19]."
August 2016 (from Judith Curry):
[...]
If I wanted to create a time series of global temperature since the 1990s, then I would [sic] NWP / variational techniques [15]."
June 2015 (from Judith Curry):
November 2015 (from Judith Curry):
Here is the figure on the global average surface temperature anomalies from the ECMWF reanalyses (ERAi) published by ECMWF earlier this year [...].
[...]
The main features from the conventional temperature analyses are barely recognizable in the CFSR – 1998 is barely a blip and 2014 is nothing close to a warmest year.
I am not sure what to make of the differences between ECMWF and CFSR. ECWMF has the most comprehensive and best data assimilation system in the world, so I am inclined to pay serious attention to their global surface temperature analysis. In any event, I would like to see much more attention paid to interpreting the reanalysis products in terms of recent global temperature trends [18]."
November 2015 (response from Ryan Maue):
ECMWF uses 4-D variational data assimilation to optimally combine all sources of data include satellites, surface stations, balloons, aircraft, ships, etc.
A new reanalysis is being conducted called the ERA5 under the auspices of the ERA-CLIM2 project. This model will be coupled (atm+ocean) and provide the best estimate yet of the historical climate system from essentially the point of view of the best weather modeling system currently available [17]."
December 2015 (from Judith Curry):
August 2016 (from Judith Curry):
"In principle, the global reanalyses provide the best approach for developing truly global temperature datasets. The assimilation of multiple different types of data not only improves spatio-temporal coverage, but reduces the biases that would be associated with individual datasets. The reanalysis process provides a dynamically consistent way for providing a truly global dataset that does not rely on kriging, extrapolation or other infilling methods.
[...]
This paper is also important in that it establishes the ECMWF Interim Reanalysis as a useful data set for examining regional and temporal climate variability in recent decades. Of particular relevance are plans for ERA-CLIM2:
[...]
[In my opinion], this is where true progress lies in terms of understanding the global temperatures (not to mention the water and carbon budgets) [20]."
"Just a warning about using one of my (really) old maps that still circulates. NCEP CFSR reanalysis has a significant problem after March 2011 when the model switched from T382 to T574. This creates a mismatch if you compare months before & after. Only use the JRA-55 or ERA5 [239]."
"These old maps I created 10-years ago from CFSR have a fatal flaw: the model changed in 2011 so the climatology & real-time numbers (e.g. July 2019) are mismatched. Do NOT use. Use ERA5 or JRA-55 (like I do) [21]."
"The reanalyses (e.g. ERA5) address my criticisms, and I think this is a much better approach to dealing with 'extrapolating' observations to data sparse Arctic Ocean [681]."
"For trends in global temperature, I much prefer reanalyses such as ERA5, with the obvious caveat that this record only goes back to 1980 (soon to go back to 1950) [925]."
"This is why i prefer the reanalyses, such as ERA5. They assimilate the radiances measured by the satellites. [...] Effectively, the data assimilation/model dynamically interpolates into data sparse regions; much preferred relative to extrapolation, kriging, etc. [927]."
Supplementary Section 2.2: Timeline of Some of Curry's Claim on the Supposed Pause/Hiatus[...]
This paper is also important in that it establishes the ECMWF Interim Reanalysis as a useful data set for examining regional and temporal climate variability in recent decades. Of particular relevance are plans for ERA-CLIM2:
[...]
[In my opinion], this is where true progress lies in terms of understanding the global temperatures (not to mention the water and carbon budgets) [20]."
August 2019 (from Ryan Maue):
August 2019 (from Ryan Maue):
February 2020 (from Judith Curry):
"For trends in global temperature, I much prefer reanalyses such as ERA5, with the obvious caveat that this record only goes back to 1980 (soon to go back to 1950) [925]."
"This is why i prefer the reanalyses, such as ERA5. They assimilate the radiances measured by the satellites. [...] Effectively, the data assimilation/model dynamically interpolates into data sparse regions; much preferred relative to extrapolation, kriging, etc. [927]."
Below are examples of Curry defending the notion of a pause or a hiatus in global warming, along with the times at which she made those claims. This is not meant to be an exhaustive list, but instead more of an overview of some of Curry's typical claims on this subject during the time-periods in question. So, once again, feel free to take Curry's advice and "read what [she] write[s] [806]":
"I have a company Climate Forecast Applications Network that is in the business of making predictions. Our predictions are quite good, otherwise we would go out of business.
[...]
I first publicly predicted a flat temperature trend for the next few decades in this post in Jan 2012
[...]
A year earlier, Jan 2011, I made it pretty clear that I supported Tsonis’ argument regarding climate shifts and a flat temperature trend for the next few decades [...] [2]."
(I address Tsonis' [190, page 4; 191, paragraphs 14 and 15; 192 - 194; 426; 427] false temperature trend predictions in "Myth: No Global Warming for Two Decades").
November 2011:
"‘Warming’ means a rate of change of temperature that is greater than zero. Here I define “stopped” to mean a rate of change of temperature that is less than or equal to zero. Here I define “pause” to mean a rate of increase of temperature that is less than 0.17 – 0.2 C/decade. Why 0.17 -0.2 C/decade as a threshold? From the IPCC AR4 re global temperature trends:
- Observed temperature trends (C/decade) for the period 1979-2004: CRU 0.163; NCDC 0.174; GISS 0.170 (Chapter 3)
- Observed temperature trend (C/decade) 1981-2005: 0.177 (FAQ 3.1)
- “For the next two decades, a warming of about 0.2°C per decade is projected for a range of SRES emission scenarios.” (Summary for Policy Makers)
A key issue in identifying and interpreting the pause is the start date chosen to evaluate a pause. If one is seeking to identify an anthropogenic signal, one should choose years at each end point that are neutral in terms of ENSO and also the 9.1 year AMO signal discussed by Muller et al. For a short temperature record (i.e. of relevance to assessing whether there has been a pause over the past decade), this isn’t feasible. In any event, identifying an AGW signal on this short timescale isn’t useful. What is of interest on this timescale is whether natural variability (forced and unforced) can dominate the AGW signal on decadal timescales and produce a ‘pause’ or a ‘stop’. This is the issue addressed by Santer et al., searching for the AGW signal amidst the natural variability noise. Santer et al. argue that “Our results show that temperature records of at least 17 years in length are required for identifying human effects on global-mean tropospheric temperature.” [97]"
January 2012:
"It is a plausible scenario that we will continue to see relatively flat trend in temperature for the coming decade. The most recent climate shift has been argued (Tsonis et al) to have occurred 2001/2002. A climate shift would probably occur sometime before 2050, although whether the shift trends warmer or cooler remains to be seen. At some point a warming trend would likely resume. To me this seems like a more plausible scenario than the 0.2C/decade projection to 2050 from [IPCC] AR4 [959]."
February 2012:"It is a plausible scenario that we will continue to see relatively flat trend in temperature for the coming decade. The most recent climate shift has been argued (Tsonis et al) to have occurred 2001/2002. A climate shift would probably occur sometime before 2050, although whether the shift trends warmer or cooler remains to be seen. At some point a warming trend would likely resume. To me this seems like a more plausible scenario than the 0.2C/decade projection to 2050 from [IPCC] AR4 [959]."
"Is the first decade+ of the 21st century the warmest in the past 100 years (as per Peter Gleick’s argument)? Yes, but the very small positive trend is not consistent with the expectation of 0.2C/decade provided by the IPCC AR4. In terms of anticipating temperature change in the coming decades, the AGW dominated prediction of 0.2C/decade does not seem like a good bet, particularly with the prospect of reduced solar radiation [98]."
"However these data end up being analyzed, the trend since 1997 is very small, much smaller than the decadal trend of 0.2C that we have been led to expect by the IPCC for the early part of the 21st century. [...] If you are using data to evaluate the IPCC’s projection of 0.2C/decade warming in the first two decades of the 21st century, with plateaus or pauses at most of 15-17 yrs duration, well then you can pick whatever start date you want [677, with 972]."
June 2013:
"Attention in the public debate seems to be moving away from the 15-17 yr ‘pause’ to the cooling since 2002 (note: I am receiving inquiries about this from journalists). This period since 2002 is scientifically interesting, since it coincides with the ‘climate shift’ circa 2001/2002 posited by Tsonis and others. This shift and the subsequent slight cooling trend provides a rationale for inferring a slight cooling trend over the next decade or so, rather than a flat trend from the 15 yr ‘pause’ [3]."
July 2013:
"I understand that 15 years is too short, but the climate model apostles told us not to expect a pause longer than 10 years, then 15 years, then 17 years. Looks like this one might go another two decades [4]."
September 2013:
"[...] as temperatures have declined and climate models have failed to predict this decline, the IPCC has gained confidence in catastrophic warming and dismisses the pause as unpredictable climate variability [...] [10]."
(Curry published her claims on the stadium wave hypothesis in a number of venues [184 - 186; 188; 189; 250; 417].)
January 6, 2014:
January 20, 2014:
"After expecting an increase of 0.2°C per decade in the early decades of the 21st century from the AR4 statements, the rate of warming over the past 15 years is only ~0.05C.
The IPCC AR5 bases its projection for the period 2016-2036 of 0.10 to 0.23°C per decade on expert judgment, rather than on the climate model results
The IPCC does not have a convincing or confident explanation for the hiatus in warming [54]."
The IPCC AR5 bases its projection for the period 2016-2036 of 0.10 to 0.23°C per decade on expert judgment, rather than on the climate model results
The IPCC does not have a convincing or confident explanation for the hiatus in warming [54]."
"Well that is an interesting ‘forecast.’ If this is natural internal variability, e.g. the stadium wave (which includes the PDO), then you would expect warming to resume at some point (I’ve argued this might be in the 2030’s). This would make the hiatus 30+ years (similar in length to the pevious [sic] hiatus from 1940 to 1975). This is long enough to invalidate the utility of the current climate models for projecting future climate change [57]."
March 2014:
"The stadium wave hypothesis provides a plausible explanation for the hiatus in warming and helps explain why climate models did not predict this hiatus. Further, the new hypothesis suggests how long the hiatus might last.
[...]
Implications for the future: I. IPCC AR5 view
.
The hiatus will end soon, with the next El Nino
.
Implications for the future: II. View emphasizing natural internal variability
.
The ‘hiatus’ will continue at least another decade
[...]
Hiatus persistence beyond 20 years would support a firm declaration of problems with the climate models [5]"
October 2014:
"Moreover, the estimates in these empirical studies are being borne out by the much-discussed “pause” or “hiatus” in global warming—the period since 1998 during which global average surface temperatures have not significantly increased.
This pause in warming is at odds with the 2007 IPCC report, which expected warming to increase at a rate of 0.2 degrees Celsius per decade in the early 21st century [7]."
January 2015:
"I’ve made my projection – global surface temperatures will remain mostly flat for at least another decade. However, I’m not willing to place much $$ on that bet, since I suspect that Mother Nature will manage to surprise us. (I will be particularly surprised if the rate of warming in the next decade is at the levels expected by the IPCC.) [8]"
March 2015:
"My take on how the pause will play out is summarized in the stadium wave post: I expect that the natural variability will contribute to a continuation of the hiatus into the 2030’s, with solar and volcanoes being a wild card [9]."
November 2015:
1) the rate of warming over a particular period of at least 10 years is not statistically significant from zero (with the context of a nominal 0.1C uncertainty). Note the IPCC AR5 cited: “As one example, the rate of warming over the past 15 years (1998–2012; 0.05 [–0.05 to +0.15] °C per decade is smaller than the rate calculated since 1951 (1951–2012; 0.12 [0.08 to 0.14] °C per decade)”
2) the rate of warming over a particular period of at least 10 years is less than the warming projected by the IPCC AR5: “The global mean surface temperature change for the period 2016–2035 relative to 1986–2005 will likely be in the range of 0.3°C to 0.7°C (medium confidence).” This translates to 0.1C to 0.233C/decade. (Note the AR4 cited a warming rate of 0.2C/per decade in the early 21st century).
3) Periods meeting the criteria of either 1) or 2) are particularly significant if they exceed 17 years, which is the threshold for very low probability of natural variability dominating over the greenhouse warming trend.
[...]
Trends exceeding 0.1C fail to pass criteria 1) and 2) above, hence the new data set does not satisfy either criteria for a hiatus [18]."
March 2016:
"And what of the years following 2016? Will we see cooling and then a continuation of flat temperatures? Or continued warming? I suspect that there will be some cooling and continued flatness. I’ve stated before that it will be another 5 years before we have the appropriate prospective on the current temperature fluctuations and whether or not the early 21st century pause is over [13]."
January 2017:
"[...] the hiatus is still going strong in the satellite dataset of lower atmospheric temperatures [...] [247]."
January 2018:
"2018 climate: I predict that global average 2018 surface temperatures won’t be ‘top five’, i.e. cooler than the last few years [32]."
July 2018:
"It is possible that a shift to the cold phase of the AMO is underway, which would extend the warming hiatus for ~2 decades [14]."
April 2021:
"My take is that we are still in the multi-decadal hiatus that began around 2000. The 2014-2018 was a subdecadal blip in the PDO. I expect this hiatus to continue at least another decade [1182, with 1180]."
"My take is that we are still in the multi-decadal hiatus that began around 2000. The 2014-2018 was a subdecadal blip in the PDO. I expect this hiatus to continue at least another decade [1182, with 1180]."
October 2023:
"John Kennedy gets that we are still in the multidecadal hiatus period, with negative PDO [1186]."
(Citing this:
"As I noted, the PDO is likely still in its negative phase, at least according to a twitter survey. Whether we’re still in a hiatus was a question I wanted to raise rather than answer. Not every question needs a question mark; sometimes you have to rely on the reader to supply their own13. The question mark here arises because one of the putative drivers of the hiatus is still in place, but the response variable – global temperature – is not playing along, unless it is: if this is still a hiatus, what happens when it ends? While I slept, Zeke was doing some sums and has already declared October a record [1187, with 1190].")3. Posts Providing Further Information and Analysis
- "Myth: No Global Warming for Two Decades"
- "Myth: Evidence Supports Curry's Claims Regarding Satellite-based Analyses and the Hot Spot"
- "Myth: The IPCC's 1990 Report Over-estimated Greenhouse-gas-induced Global Warming"
- Section 2.2 of: "Myth: Santer et al. Show that Climate Models are Very Flawed"
- Section 2.4 of: "Myth: Attributing Warming to CO2 Involves the Fallaciously Inferring Causation from a Mere Correlation"
- "Myth: Judith Curry Fully and Accurately Represents Scientific Research"
- "Myth: El Niño Caused Post-1997 Global Warming"
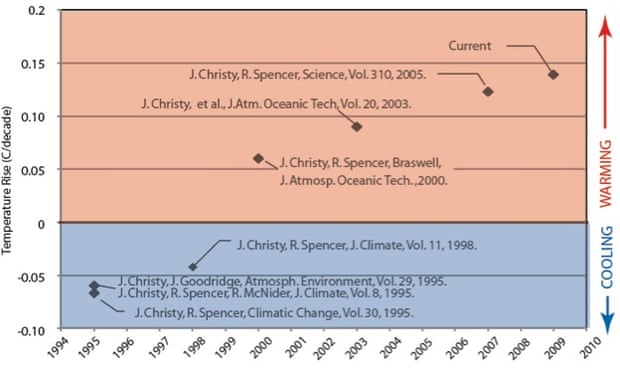
No comments:
Post a Comment